Quantcast
Channel: Freelap USA
Viewing all 211 articles
Browse latest View live

Vitamin D: Does It Really Improve Athletic Performance and Prevent Injuries?

$
0
0

Female Runner on Beach

By Craig Pickering

If you were involved in sport in 2010, you almost certainly encountered discussions about vitamin D. It was very much the supplement du jour back then. Plenty of research showed its function in performance, as well as the prevalence of insufficiency. This research kindled interest that remains strong today.

What is it?

Vitamin D refers to a group of vitamins. The most important are D2 (ergocalciferol) and D3 (cholecalciferol). The sun is the primary source of vitamin D for most people, as it isn’t widely available in foods. This situation obviously causes issues in individuals who don’t get much sun exposure. More on this later.

What does it do?

Vitamin D plays many important roles in the body. There is some evidence that it affects the risk of cardiovascular disease and cancer. Low levels of vitamin D can have a negative effect on the immune system, muscle function, stress fractures, and injury risk.

These studies suggest that we need to ensure athletes have sufficient levels of vitamin D. The main issue here is availability. Since the main source of vitamin D for most people is the sun, insufficient sunlight exposure causes problems. This can be either a result of low levels of ambient sunlight (especially in winter), or spending most of the day indoors. Some conflicting evidence suggests that sunscreen use may also reduce vitamin D levels.

In a 2012 paper, leading sports nutritionist Dr. Graeme Close measured vitamin D levels in the blood of a group of athletes which included soccer and rugby league players, as well as non-athletes. Close took blood samples during the winter months, with a blood vitamin D level of 100nmol/l suggested as optimum. The results were staggering. Only one of the 61 athletes had a vitamin D concentration of 100nmol/l or greater. The median value among the athletes was less than 75nmol/l, and less than 50nmol/l for non-athletes. You might think this is a problem exclusive to more northerly latitudes, but a study of NCAA athletes reported similar results (It should be noted that the authors use different units to measure vitamin D). In a study of Middle Eastern athletes, 91% were deficient, with 59% showing an increase in stress fracture risk. So even though we might know we need sufficient vitamin D—especially from a performance standpoint—many athletes still aren’t getting enough.

How much vitamin D do we need on a regular basis?

The recommended daily allowance (RDA) for vitamin D varies from country to country, and it is typically 400IU-800IU per day. This amount probably is enough to avoid deficiency but not to ensure optimal levels, especially for athletes. The problem is that there are no accepted guidelines for optimal vitamin D intake for sports performance, although research indicates an optimal blood value of around 100nmol/l. To achieve this value, Dr. Reinhold Vieth (1999) recommends a daily intake of 4000IU. This amount sounds reasonable, although I used to supplement with 5000IU per day. After three years at this level, my vitamin D levels were still less than 100nmol/l. Nevertheless, 4000-5000IU appears to be a decent daily target.

You can get too much of a good thing, however. You need to be wary of vitamin D toxicity, (hypervitaminosis D). Symptoms include fatigue and muscle weakness—hardly ideal for athletes—vomiting, decreased appetite, and dehydration. In some cases, it can also lead to calcification of soft tissues. Fortunately, the Vieth paper (it is good–please read it!) asserts that there isn’t any evidence of adverse reactions at blood vitamin D levels of less than 140nmol/l, which would require approximately 10,000IU of vitamin D per day.

One thing to consider is that vitamin D is fat-soluble, which means it can be stored— potentially making toxicity more likely. Toxicity can only occur through food/supplemental sources, however, as the creation of vitamin D through sunlight has a feedback loop that guards against excess. The half-life of vitamin D within the body in its storage form is about one month, so people getting a lot of sun exposure and supplementing should be careful throughout the summer and autumn months.

Vitamin D Sources

One thing to be aware of is the different forms of vitamin D. Vitamin D from sunlight is of the D3 variety. Vitamin D from vegetables and fortified products often comes as D2. Which is better? Most research indicates that D3 is much more effective than D2 in humans, although some studies counter this.

Where can we get vitamin D? Some foods contain it, although not in especially high amounts. Oily fish has around 750IU per 100g, and this is D3. Foods like mushrooms contain D2, although the amount can vary. Fortified milk and juice products can contain both varieties.

Sunlight, of course, is another option. Total body sun exposure can easily provide 10,000IU (Vieth), which is plenty. However, the obvious risk here is skin damage from sun exposure, including the risk of melanoma and squamous cell carcinoma. This paper from Barbara Gilchrest in the American Journal of Clinical Nutrition examines both sides of the issue. Another factor to consider is that dark skin requires a greater amount of sun exposure for adequate vitamin D formation, which is why African Americans are at greater risk of vitamin D insufficiency.

Supplementation

The final avenue is vitamin D supplementation. The most common regimes are between 2500IU and 5000IU per day, although 50,000IU per month (1660IU per day) over the winter months was effective in increasing vitamin D levels in a group of elite athletes. I used to take 5000IU per day in the winter, when my sun exposure was essentially non-existent, and 2500IU in the summer when I was getting more sun. Ideally, you should choose a supplement that contains vitamin D3, the more readily available form. Often this comes in an oil-based capsule, which is fine; if it comes in more of a powder, consuming it with fatty foods will increase absorption. Supplementation has some benefits. You know how much you’re getting (assuming the manufacturers are truthful), and you aren’t risking skin damage from the sun.

Does supplementation help? The Close article cited earlier has a second part. The researchers recruited 14 footballers from a Premier League club academy (not a huge sample, admittedly). Half took 5000IU of vitamin D per day for eight weeks, the other half a placebo. The players did a battery of physical tests before and after supplementation.

Both groups increased their plasma vitamin D levels, although only the supplementation group did significantly better—presumably the placebo group was also getting some sun exposure. The supplement group saw a significant improvement in their vertical jump and 10m sprint performance, while the placebo group didn’t. There was a trend toward significance in improvements in 1-RM bench press and back squat too; this means it didn’t quite meet the significance level but was close. The supplement group improved bench press on average by 6.5kg, compared to 2.5kg in the placebo group. Back squat 1RM improved by 9kg, compared to 3kg in the placebo group.

Makes you want to use vitamin D supplements, doesn’t it! Just remember that these athletes were not only most likely deficient to start with, but also still developing physically. It follows that greater improvements would be likely. The same research group conducted a larger research trial a year later and found no effect of vitamin D supplementation on performance measures.

In a group of ballet dancers, daily supplementation with 2000IU increased vertical jump (a measure of power) and reduced injury risk. In a group of Greek professional soccer players, increased vitamin D levels were associated with performance improvements in various jumping exercises, sprint performance, and VO2 max. Subjects in this study did not undertake supplementation but instead received all their vitamin D from the sun.

Some early research shows that vitamin D may have a role in increasing type II muscle fibers. This research was conducted in stroke patients, so we have no idea if it would still be the case in healthy individuals. Similarly, animal studies suggest that vitamin D intake might have a role in protein synthesis. These results have not been replicated, especially in humans.

Vitamin D supplementation may have a protective effect against injuries, particularly stress fractures. In a group of female Navy recruits, daily supplementation of just 800IU vitamin D reduced stress fracture risk by 20%. Similarly, higher intakes of vitamin D in a group of female cross country runners were associated with a decreased risk of stress fracture.

Vitamin D supplementation can increase testosterone levels. Higher levels of testosterone may be associated with more favorable adaptations to resistance exercise (although the evidence on this isn’t always great), and may also increase competitive drive. In this study, daily supplemention of 3332IU for a year led to a significant increase in testosterone levels.

Vitamin D supplements can have a positive effect on muscle recovery. In a 2013 study, researchers gave a group of males either 4000IU per day for 28 days or a placebo before they underwent a fairly strenuous exercise protocol. Subjects who supplemented with vitamin D had a lesser increase in biomarkers associated with muscle damage and soreness than those in the placebo group.

Finally, sufficient levels of vitamin D can have an important knock-on effect by improving post-exercise recovery, possibly by causing an increasing in anti-inflammatory cytokines. Low levels of vitamin D are also associated with an increased risk of illness.

Testing of Vitamin D

Vitamin D testing is relatively easy and straightforward, depending on where you live and regulations governing that region. In the UK, vitamin D testing can be conducted via a GP (if you ask nicely), or you can order a kit online for less than £40. In the USA, tests cost about $50. In Australia, vitamin D tests cannot be sold directly to consumers, Testing needs to be conducted by a practitioner.

After getting your vitamin D tested, it’s important to know how to interpret the results. The Institute of Medicine (IOM) provides these guidelines:

  • <30 nmol/l – deficient
  • 30-50 nmol/l – inadequate
  • 50> nmol/l – adequate

When I was an athlete, my governing body regularly conducted vitamin D testing. Their guidelines were similar to the IOM–they didn’t want any athletes below 50 nmol/l, and preferred us to be around 100 nmol/l. Some blood tests give results in ng/ml, so you will have to convert to nmol/l. Plenty of online calculators do this.

Summary and Conclusions

Vitamin D deficiency and insufficiency are common in athletes. This can lead to a whole host of issues, including increased injury risk, poorer recovery, reduced muscle strength, and decreased immune function. Vitamin D can be obtained in relatively small amounts from food. Sun exposure represents an excellent source of vitamin D. However, the possibility of skin cancer should not be taken lightly.

Supplementation appears to be the safest way to increase vitamin D levels. However, there are no accepted guidelines on supplementation levels for athletes. The majority of research uses daily doses of 2500IU-5000IU per day. This amount represents a good starting point. It is generally accepted that intakes below 10000IU per day are safe for most people. Regular blood testing of vitamin D levels is relatively inexpensive and gives a good indication of current supplemental needs. While the evidence shows that athletic performance can suffer if vitamin D levels fall below 50nmol/l, it is not clear that levels well above this enhance performance.

Please share so others may benefit.

The post Vitamin D: Does It Really Improve Athletic Performance and Prevent Injuries? appeared first on Freelap USA.


The Speed Reserve Algorithm: A Simple Way to Attach Meaning and Significance to Sprint Workouts

$
0
0

Anaerobic Speed Reserve

By Ken Jakalski

I very much agree with Carl Valle’s insights on assessment, as wells as my Illinois colleague Tony Holler’s insistence on recording, ranking, and posting sprint times.

Since 2004, what has helped me in applying their approaches has been using the Bundle/Weyand speed regression algorithm in designing speed workouts for my sprinters.

The algorithm is related to research investigating what limits sprint exercise performance. The classic explanation has been that speed decreases as the event duration increases because of an energy supply limit. Researchers assumed that, if energy limits all out performance and we increase energy supply, performance will improve. Likewise, if we decrease demand, performance will improve. That explains why many speed coaches still target supply and demand, which I now describe as the “kind of training Tony Holler hates” because it results in, as Tony notes, “stupid coaches having the hardest practices.”

Even as far back as 1925, the legendary A.V. Hill questioned whether this energy supply conclusion applied to sprinting. “It is obvious that we cannot pursue our (energy supply) argument to times below about 50 seconds,” said Hill. “These performances are limited by factors mechanical and nervous.”

A V Hill Timing Gates

Despite Hill’s suggestion that high-speed performances need to be looked at differently, even to this day, there are many who continue to accept the classic notion of why speed declines over time. After all, it did apply to distance running, and why consider alternatives to an approach that prior to 2003 nobody was considering, perhaps because there was no energy data available for sprinting?

Bundle and Weyand put forth their view in the 2012 article, “Sprint Exercise Performance, Does Metabolic Power Matter?” Their conclusion was that speed declines as a result of musculoskeletal force output. They continue to use a simple analogy to explain what they mean. Is the (horse)power source (a car engine) limited by the fuel supply (ATP) or the transmission (muscle, tendon, and bone)?

For sprinters, reducing fuel supply has no effect on speed. Changing mechanics does. In their words, “energy release in sprinting is demand driven and not supply limited. It is at this point that speed coaches like Tony Holler would be saying, “I told you so.”

If performance in sprinting does depend on force application, how can we apply good science to improve performance? Certainly, fast, short repetitions make perfect sense, in combination with strength work, and the mechanics that recent research from Dr. Ken Clark indicates what it is that elite sprinters are doing at high speed.

What I do, by way of the original Bundle/Weyand research, is to use the force approach—or speed reserve by way of the algorithm presented in their 2003 paper, “High-speed running performance: a new approach to assessment and prediction.” What appears below is the table version of that algorithm I use with my sprinters. The table will generate speed projections at my distance of choice for each sprinter on my team, after inputting two measurements: each athlete’s top sprint speed (by way of a fly-in 10 or 20-meter sprint, and top aerobic speed ( by way of a 300-meter sprint).

ASR Chart

What ASR does for me is to provide individualized, specific goal times for my high speed/short repetition workouts. My tables also list a termination time for each athlete. That “fall-off” time reflects a drop in speed that changes the focus of the workout. Athletes could continue to run reps, but when the speed drops below a prescribed percentage (like 4%) athletes are could keep doing reps at slower and slower speeds, and that can quickly become the kind of workout that, as Holler might say, “takes the “cat” out of sprinters.”


The ASR algorithm provides individualized, specific goal times for high speed/short repetition workouts.
Click To Tweet


Do coaches need this kind of specificity to achieve what Dr. Weyand describes as “attainable intensity”? Probably not. Fast running is fast running, and “100% intensity” perhaps needs no additional qualifiers.

I have found that my athletes concentrate better when they have a specific target for the workout and are certain of what is expected from these kinds of formative assessments. It’s the way I try to ensure that, in Coach Holler’s words, “low effort never happens in speed training.”

ASR helps me to accomplish what Holler believes is essential to a successful sprint program: demanding quality and making times meaningful.

Editors note: To perform your own ASR Calculations, see the online Sprint Calculator and User Guide.

Please share so others may benefit.

References

Bundle, Matthew W., Reed W. Hoyt, and Peter G. Weyand. “High-speed Running Performance: A New Approach to Assessment and Prediction.” Journal of Applied Physiology 95.5 (2003): 1955-962. Web.

Bundle, Matthew W., and Peter G. Weyand. “Sprint Exercise Performance.” Exercise and Sport Sciences Reviews (2012): 1. Web

Clark, K. P., and P. G. Weyand. “Are Running Speeds Maximized with Simple-spring Stance Mechanics?” Journal of Applied Physiology 117.6 (2014): 604-15. Web.

The post The Speed Reserve Algorithm: A Simple Way to Attach Meaning and Significance to Sprint Workouts appeared first on Freelap USA.

Concurrent Training: Implications for Freestyle Wrestling Performance – Striving for Optimal Training Practice

$
0
0

Female Freestyle Wrestlers

By Carmen Bott MSc. CSCS

Introduction

“In order to become a wrestler one should have the strength of a weight- lifter, the agility of an acrobat, the endurance of a runner and the tactical mind of a chess master.” — Alexandre Medved

Wrestling is a dynamic, high-intensity combative sport that requires complex skills and tactical excellence for success (Zi-Hong et al., 2013). To be successful on the world stage, wrestlers need very high levels of physical fitness. Wrestling demands all qualities of fitness: Maximal strength, aerobic endurance, anaerobic power and anaerobic capacity. To be effective, wrestling techniques must also be executed with high velocity (Zi- Hong, 2013). Enhancing the functional ability of each of these physiological qualities is the primary aim of the Wrestling S&C Coach.

Athletes who wrestle at an elite level (international caliber) are often required to perform strength, power, and endurance training concurrently with aims to achieve improvements in all performance measures. Concurrent training is defined in the literature as strength and endurance training in either immediate succession or with up to 24 hours of recovery separating the 2 exercise modalities (Reed at al, 2013). Much of the research indicates a possible attenuation of strength and power as a result of concurrent training while aerobic capacity and endurance performance appear to be minimally affected (O’Sullivan, 2013). Concurrent training also applies in the technical and tactical development of the wrestler. Often the rigorous demands of practice can create a high level of fatigue, which must be considered when we advise a training program.

Although concurrent training does allow for the training of multiple physical qualities, it does place great adaptive demands on the athlete. The acute responses and long-term adaptations of the Neuromuscular and Neuroendocrine systems seem to be the most relevant areas to investigate with this population. Many factors appear to determine the adaptive ability of elite wrestlers to concurrent training, including the athlete’s level of physical conditioning, overall life stressors, nutrition1, overall training volume, and the training program design.

1Psychological and nutritional aspects are beyond the scope of this article.

Gaining insight into the most optimal ways to minimize interference by understanding models of fatigue are the cornerstones of this article. Also, understanding and analyzing elite level wrestlers’ physiological data gives practitioners insight into the benchmarks their athletes must reach to perform at the highest level.

The objectives of this article are as follows:

  1. To highlight the physiological profile of elite, word-class male and female wrestlers.
  2. To review concurrent training literature and observe the adaptations that result from different methodology.
  3. To offer some programming strategies to minimize the interference effect and optimize the adaptation process.
  4. To provide some future study design directions for researchers in this area so that the training programs being evaluated are an accurate representation of elite freestyle wrestling performance.

The Sport of Wrestling


Wrestling can be traced back to ancient times. “During the Ancient Olympic Games, from 708 B.C., wrestling was the decisive discipline of the Pentathlon. In fact, it was the last discipline to be held – after the discus, the javelin, the long jump and the foot race – and it designated the winner of the Pentathlon, the only crowned athlete of the Games” (United World of Wrestling Website).

Freestyle wrestling first made its appearance in 1904. In Greco-Roman wrestling only upper body moves are allowed, whereas freestyle includes upper body and leg wrestling. Both styles are currently offered in the Olympic Games and other international competition (Horswill, 1992). In September 2001, the International Olympic Committee announced the inclusion of Women’s Freestyle wrestling at the 2004 Olympic Games in Athens (Wrestling Canada website: Spectator Resources, 2016).

Wrestling can be categorized as an intermittent, combative sport that requires maximal strength and power demands of the entire body, with a high anaerobic energy metabolic demand (Passelerague & Lac, 2012). It is also a weight class sport. Competitors are matched against others of their own size. This reduces the exclusion of smaller athletes in sports where physical size gives a significant advantage.

Wrestling activity is extremely chaotic in nature, encompassing repeated explosive movements at a high intensity that alternates with submaximal work. Thus, the primary energy systems utilized are the anaerobic adenosine triphosphate-creatine phosphate (ATP-CP) and lactic acid systems, within the scope of the aerobic system. It has been demonstrated that there are no major physiological differences between wrestlers of both freestyle and Greco-Roman styles (Mirzaei, 2009).

In 1904, freestyle wrestling was first introduced during the St. Louis Games. At the Stockholm Olympic Games in 1912, freestyle wrestling was absent from the program, and ‘Icelandic wrestling’ was instead organized. Wrestling matches took place on three mats in the open air. They lasted one hour, but finalists wrestled without a time limit (United World Wrestling Website). Over the past century, the match structure of international Freestyle wrestling has taken on several forms evolving past a continuous 5-minute period in the late 1990’s to the current: Two, 3-minute periods with a 30-second rest between periods. A match may be won by “fall”, by technical superiority or by points (Wrestling Canada website: Spectator Resources, 2016). During tournaments, multiple matches per day may occur over the course of a few days. There are no rule differences for female competitors. There is no overtime period; a tie is broken by point classification in the second round.

The Physiology of a Match

National, international and Olympic wrestling events are formatted in such a way that athletes are required to compete in multiple matches over the course of hours or for a few consecutive days (Barbas et al., 2011). This scenario, coupled with a significant weight loss (>6% of total mass) may have implications for performance.

Barbas et al. examined the physiological responses of 12 elite male Greco-roman wrestlers during a one-day wrestling tournament (2011). In 2011, the rules were slightly different than they are now. There were 3 rounds, each 2 minutes in duration separated by 30 seconds rest, totaling a maximum of 6 minutes of work. Knowing this, the acute physiological responses may not be valid in today’s rule system. In Barbas’ study, they observed a mean heart rate response of 85% of maximum and a peak HR of 96-98% of maximum during a match. Blood lactate concentrations exceeded 17 mM, which was consistent with other research findings. According to Kraemer et al., lactate levels may be related to glycogen depletion due to athletes’ restricted food intake and insulin’s maintenance during a wrestling tournament (2001). Elite wrestlers typically compete in a chronically dehydrated state. Thus, it has been hypothesized their fluid regulatory systems have been reset to a new “normal” indicating a compensatory response (Kraemer et al. 2001). Kraemer et al. (2001) also reported that elite wrestlers, in this typical hyperosmotic state, are still capable of competing at an elite level demonstrating a significant resiliency suggesting an adaptation of the hypothalamic control of osmolality regulation.

In Barbas’ study, each simulated match went the full 6 minutes. The athletes completed a total of 5 matches separated by varying timelines. Blood work showed an increase in muscle damage markers during the course of the day/tournament, with the upper limbs being more affected (2011). The hormones cortisol, norepinephrine and epinephrine also increased after each match and testosterone levels declined, creating a pro-inflammatory environment (2011). Other findings included that most performance markers (VJ, HB, Bear Hug, HG) deteriorated (»13–16%) after the third match as compared with baseline. Vertical Jump performance was the only metric to restore back to baseline for the final match (*after 5 hours of rest) (Barbas, 2011).

The authors noted that a one-day wrestling tournament might decrease performance match after match (2011). Upper body strength and performance appeared more susceptible to decline during the course of a 1-day wrestling tournament than those of the lower-body musculature as previously shown by Kraemer et al. (2001). Interestingly, 5–6 h of recovery between matches 4 and 5 was inadequate to induce a perceptual recovery. Similar findings have also been reported during a two-day wrestling tournament (Kraemer et al. 2001).

The ability of wrestlers to fully recover before their next match during a tournament is vital for performance and beyond the scope of this article. However, it is important to understand the physiological responses of well-trained wrestlers when competing multiple times per day. It is also important to note that the practice of weight cutting within reason (5-6% total mass) does not appear to interfere with performance determinants as shown by Barbas’ works and Kraemer’s study on elite freestyle wrestlers (2001).

The Physiological Characteristics of Elite Senior Male and Female Freestyle Wrestlers

One of the challenges confronting coaches and sport scientists is to “understand the physical and physiological factors contributing to successful wrestling” (Mirzaei et al., 2009). The use of lab and field tests for the measurement of the current status of the wrestler can provide the sport scientist with valuable information relative to the wrestler’s current physiologic capability and can allow them to compare the athlete with reference values from comparable peer groups.

When reviewing the literature on physiological profiles one must consider the year(s) of publication. Since there have been numerous rule and thus ‘style’ changes over the past 40 years, some of the earlier data may not be as relevant in today’s version of freestyle wrestling. For example in the late 1970’s and early 1980’s Freestyle match duration changed from 9 minutes to 6 minutes. After 1988, Freestyle wrestling changed from 2, 3-minute periods with one minute rest to a continuous 5-minute period (Callan et al., 2000). Currently, the athletes compete for two, three-minute periods separated by 30 seconds rest. The knowledge acquired regarding the changes in match design is helpful in the bigger picture.

Understanding and capturing the evolution of physiological profiles of elite freestyle wrestlers is fundamental, providing normative data for strength and conditioning coaches and providing benchmarks for young, aspiring competitors. It has been demonstrated that physiological variables alone can account for “approximately 45% of the variance seen between successful and less successful Freestyle wrestling Olympic contenders” (Callan et al., 2000).

Body Composition

Wrestlers are characterized by specific morphological characteristics: “accentuated width and girth of the body, proportionally long arms and short legs, a large percentage of active muscular body weight” (Mirzaei et al, 2010). Data collected on average body fat values for Canadian elite male freestyle wrestlers in 1984 were 8.2% for all weight classes excluding the superheavyweights (Sharratt, 1984). Horswill (1988) reported average values of 7.2% bodyfat. Callan et al. (2000) collected data on elite male American wrestlers, excluding open class heavyweights, and found them to lie between 5 and 10 percent bodyfat. Mirzaei et al (2009) studied Iranian Junior freestyle wrestlers and noted an average bodyfat percentage of 10.6%. No published data can be found on the body composition of elite female wrestlers.

Although anthropometry and body composition are important areas to study when profiling athletes, it is not the focus of this article as its relationship to elite freestyle wrestling performance is not clear. Also, the effects of weight loss on performance will not be covered in any depth in this article. It appears that purposeful weight loss and its effects on performance outcomes and physiological function are highly individual and dependent on the magnitude of the weight loss. The major limitation of all previous studies on weight loss and physical performance in wrestlers is that inferences cannot be made to actual wrestling performance (Horswill, 1992).

Pulmonary and Cardiac Function

Very few studies examined pulmonary function amongst this population. Sharratt et al. (1984) found the pulmonary function, resting blood pressure and hematology measurements to “be typical of healthy adult males” and there were no sport-specific differences on these parameters. Sharatt et al. (1984) also reported in elite senior level wrestlers, maximum minute ventilation was low relative to the peak oxygen uptake values and high levels of blood lactate. He hypothesized that elite wrestlers may “hypoventilate during maximum exercise as a result of becoming conditioned to years of restricted breathing” (Sharratt et al., 1984). No data was found on elite females. There is, perhaps, a need for more research in this area.

Data collected on collegiate wrestlers have cardiac stroke volumes and left ventricular volumes similar to non-athletes but smaller than those of endurance-trained athletes. The wall and septum of the left ventricle were greater in the wrestler than in the non-athlete and endurance athlete. Because wrestling does not demand the high cardiac output or stroke volume of endurance sports, an expansion of the left ventricle chamber with training does not occur. In general, there is limited data on Pulmonary and Cardiac function on this population.

Muscle Morphology

Houston et al. (1981) identified the vastus lateralis muscle group as being a representative muscle for the study of wrestling performance. They found significant glycogen depletion in this muscle combined with an elevated blood lactate concentration following maximal effort wrestling. Scientists also biopsied the muscle group; the samples were 52% fast twitch, implying an average aerobic capacity at the cellular level (Sharratt et al., 1984). Sharratt et al. (1984) also measured the succinate dehydrogenase (SDH) activity in the vastus lateralis of senior wrestlers as an indicator or aerobic potential. They reported an activity level indicative of endurance adaptations but not to an exceptional level. Gollnick’s (1982) work indicated that although wrestlers have higher SDH levels than deconditioned males, the levels do not reflect the higher VO2 values the wrestlers possess. The published data in this area was collected on male athletes of varying levels in the mid-1980’s. This is a possible area of future investigation with both elite male and elite female wrestlers.

Strength

Strength is defined as the ability to exert force under finite conditions, independent of time and space. Strength is very much related to both velocity and biomechanics, so interpreting results of strength data when one cannot observe and monitor technique is limiting. In the wrestling literature, strength is often measured by a percentage of 1RM on a multi-joint/primary lift, by hand grip dynamometry and often expressed relative to the mass of the athlete (relative strength).

Rules changes in the 1970’s changed the tactics of the sport of Freestyle wrestling placing importance on an aggressive style of wrestling versus holding or ‘stalling.’ As a result, improving the dynamic strength of wrestlers, in all muscle actions (concentric, isometric and eccentric) became a training focus. Horswill’s review in 1992 compared successful male elite2 wrestlers to less successful wrestlers and found that greater strength to be an advantage. However, although his work is very comprehensive, Horswill did not use typical primary exercises for strength assessment. Thus, his data is not particularly useful for the strength and conditioning coach. Yoon (2002) also noted in his works that successful male wrestlers showed higher dynamic and isokinetic strength than unsuccessful wrestlers.

2Elite = International level competitor

A unique approach in how to address strength needs for this population was seen in East Germany. They tested for maximal strength through a 1-repetition max; speed strength by timing the lifting of a weight (75% of your weight class weight) for 8 reps; and tested strength endurance with maximum reps at the weight class standard. They also had performance standards for each weight class (2010 Annual Review of Wrestling Research).

Weightlifting Standards for East German Wrestlers

Table 1. 2010 Annual Review of Wrestling Research

Dr. Boris Podlivaev also shared an updated version of his performance standards at the FILA Scientific Congress held at the Moscow World Championships.

A brief synopsis is included in the chart below, based on weight class. A more comprehensive list with wrestling-specific tests can be found in the literature (Podlivaev, 2010). No information was found on the protocols for these tests or why partial scores were given. The numbers for bench press and cleans appear to be very low as compared to the East Germans standards.

Table 2. Wrestling-Specific Tests by Weight Class
TESTS 55-60 kg 66-84 kg 96-120 kg
30 m sprint (s) 4.53 4.59 4.63
60 m sprint (s) 7.9 7.79 7.8
100 m sprint (s) 12.98 12.87 13.27
Pull-ups (n) 34.4 32.4 22.6
Push-ups (n) 70 68.1 57.6
Cleans (kg) 74 82 113.5
Bench Press (kg) 83 92.50 125.5
Hanging Leg Raises (n) 18.2 15.3 14.4
800 meter sprint (min) 2.47 2.51 3.20
8 km Cross (min) 28.34 29.18 36.31

Mizraei’s case study on a World Champion Greco-Roman male wrestler (2010) collected pull-up data of 50 repetitions, (versus the National Iranian norm of 37 reps). This is considerably higher than the Russian data, but ‘how’ the tests were conducted (strict reps versus momentum) was not observed, so the data is difficult to compare.

The research on elite females by Zi-Hong et al. (2013) used several isokinetic tests at two different velocities as well as 5 isotonic exercises for evaluation. These included: Deep squats, Prone rowing, Olympic style deadlifts and Power cleans from the floor and a unique lift called the hold and squat to measure strength in elite female wrestlers. These lifts were chosen because they are part of the Chinese female wrestlers training program. Four weight categories were tested (48kg, 55kg, 63kg, and 72kg). Average values for each lift, across four weight categories, are as follows:

Table 3. Chinese Female Wrestlers Training Program
Wt. Category Deadlift Deep Squat Prone Rowing Power Clean Hold & Squat
48 kg 109 kg 90 kg 64 kg 74 kg 104 kg
55 kg 126 kg 100 kg 74 kg 75 kg 104 kg
63 kg 123 kg 99 kg 76 kg 77 kg 110 kg
72 kg 150 kg 106 kg 78 kg 82 kg 125 kg

To summarize Zi-Hong’s research, it was found that an Olympic or World Championship medalist generally demonstrated the highest 1RM value for any weight category. Other research also indicated that more experienced and successful wrestlers, as defined by the number of international tournaments, were also stronger (Zi-Hong, 2013).

It is important to mention very few papers used what would be typical strength and power exercises prescribed by a strength and conditioning coach to train and measure strength. It would be ideal to see 1RM strength data on the top male and female Freestyle wrestlers using: Deep squats, bench press, prone rowing and cleans as exercises.
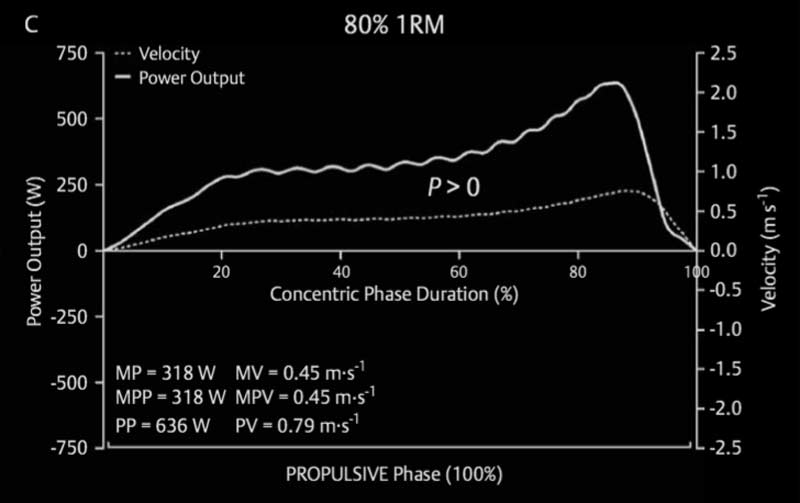
Anaerobic Power

Power is defined as the product of force (in Newtons) and velocity (in meters per second). The ability to produce a high power output is important for wrestlers. Power in wrestling is associated with quick, explosive movements that lead to control of the opponent (Horswill, 1992). Average power or mean power is often equated with anaerobic capacity. It has been reported that anaerobic power and anaerobic capacity may help to differentiate between successful and less successful male and female wrestlers.
A freestyle wrestlers’ anaerobic performances are much more similar to power athletes (sprinters, throwers, weightlifters for example) than endurance athletes. On the basis of equivalent bodyweights (W/kg), male distance runners and ultra marathoners have leg power values of 8.9 and 9.3 W/kg. In contrast, male powerlifters had values of 9.5 W/kg, male college wrestlers 9.4 W/kg, and male gymnasts 9.1 W/kg (Horswill, 1992).

Similarly, the anaerobic power of the upper and lower body of male wrestlers is much greater than the corresponding values in nonathletic men of similar age (Horswill, 1992). The published values on most wrestlers at any level exceed the sixty-fifth percentile of lower body anaerobic capacity and anaerobic power of nonathletic adult males (Horswill, 1992). At the time Horswill published his review, there was very little data comparing elite and non-elite wrestlers using the Wingate test.

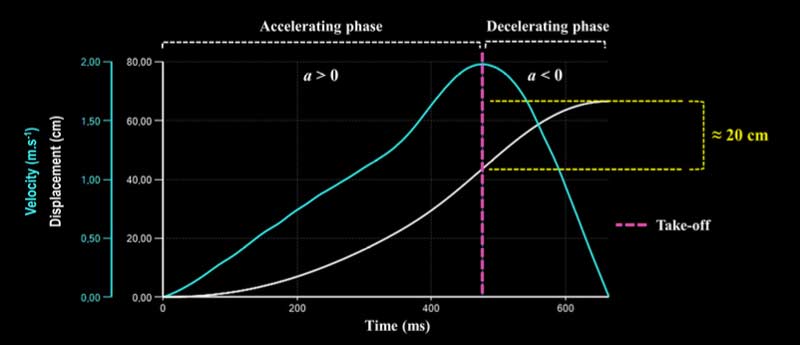
Lower body anaerobic power has been evaluated using a vertical jump test with counter-movement. The 1997 United States male freestyle wrestling world team averaged 60 cm (Utter et al., 2002). Unpublished data from the US Olympic Committee (Callan et al., 2000) showed Greco-Roman male wrestlers to have average counter-movement vertical jumps of 62 cm. Russian data by Podlivaev had average scores ranging from 56.70 cm to 66.10 cm. Protocols for the Russian data were not given, and elite female scores on vertical jump were not found.

Upper body anaerobic capacity is frequently evaluated with arm cranking on bicycle ergometers. Performance of the upper limb muscles reflects the potential of muscles to derive ATP via fast glycolysis.

Horswill et al. (1992) had 12 well-trained male collegiate wrestlers perform a multi-stage upper body Wingate test, with 6.5 g per kg of body weight (8 x 15 seconds with a 30 second rest between stages, over 6 minutes). A power production curve over the 8 sprints is graphed. They found sprint power ranged from 3.7 to 4.6 W/kg/bw. This testing has not been reproduced elsewhere and was not conducted on elite level male or female wrestlers, so it is difficult to interpret. Callan (2000) reproduced a similar test with 5, 30-second efforts designed to simulate a 5 minute match. The data collected on his study may not be valid with the rules in place today, as the match periods are shorter. Upper body Wingate normative data seems exclusive to these precise studies.

Female wrestlers in the Zi Hong study (2013) performed a standard wingate test, using a higher relative load of .08 x body mass and demonstrated maximal peak power values between 7.04 W/kg and 9.12 W/kg. It is important to mention, for the purpose of comparison, most normative data using the 30 second Wingate (lower body) for elite female athletes is based on .075 x body mass. It must be noted male athletes generally have 10% and 17% higher peak and mean power than women when expressed relative to kg lean body mass (LBM).

Blood lactate readings have been evaluated post-match as well as after Wingate tests and other tests of maximal effort in several studies. Average post-match values (5 min) for elite males on the Turkish National Greco-Roman team in 2006 was 12.3 mmol/L. In Zi-Hong’s works post-Wingate blood lactate values reached an average peak of 11.69 mmol/L (2013). What might be more interesting and relevant is Dr. Ramazan Savranbasi’s work where the Lactate recovery co-efficient is calculated following a match or a standardized exercise bout (2010 Wrestling Research Annual Review).

In Zi-Hong’s work with elite females, mean peak power, relative to body mass (in Watts per kilogram), fatigue index (%) and 400-meter time demonstrated no significant difference between weight categories (2013). The 400-meter time was, however, significantly correlated with maximal peak power.

Callan et al. (2000) investigated a rope climb as a means to evaluate upper-body muscular anaerobic power and endurance. The athlete was instructed to climb a 5.6-meter rope hand over hand arms only. The total time was recorded to cover this distance. Although this is a highly task-specific test, it is a useful field test. Average times were 9.3 seconds for the 1997 World (male) U.S.A. Freestyle team. No other studies have replicated this test making it difficult to create an optimal standard or correlated a result with wrestling performance. The Russians have used a 4-meter hand only climb, but only test results were given (time) versus exact protocols.

Anaerobic capacity was measured in elite Canadian freestyle male wrestlers using the Anaerobic Speed Test (Sharatt, 1984) The athletes performed two maximal efforts, separated by a 4-minute rest. Blood lactate values were taken 5 minutes into recovery. Athletes ran the first repetition in an average of 55.6 seconds for all weight classes (individual weight classes were not indicated) and for the second interval, an average of 45.3 seconds. No normative data for elite wrestlers using this test is available. Blood lactate levels read an average of 14 mmol/L, similar to values for other athletes in sports with a major anaerobic contribution (Sharatt, 1984). At that time, the best Russian wrestler generated over 20 mmol/L (Sharratt, 1984).

Anaerobic power and capacity may be the points of difference between successful and less successful wrestlers. The anaerobic power and capacities of elite junior (18-20 years old) wrestlers are greater by as much as 13% than those of non-elite wrestlers of similar weight, age and wrestling experience (Horswill, 1992). The Olympic and World Champion female test results on both the Wingate and 400-meter run are at the upper end or the best value (Zi Hong et al., 2013).

With respect to anaerobic testing, it appears there are no universal tests for wrestlers and that perhaps a battery of tests might serve to highlight power objectives as well as limiters in performance.

Speed of Movement

The speed at which an athlete move his body in response to a stimulus is an important quality in wrestling. Much of the research on wrestlers on this quality dates back to 1958, where they determined reaction time to be non-critical (Horswill, 1992). Taylor (1979) was the first to establish a wrestling specific test of reaction time, but the subject pool was too small (Horswill, 1992). More recently, Mirzaei et al. (2010) collected data using an instrumental jumping pad in front of a reaction time apparatus. The athletes were instructed to react to a visual stimuli by moving his foot from the pad. The best of 3 trials was collected for each subject. The National norm in Iran was 391 ms (Mirzaei, 2010). No other published data from other countries is available. And no published data on control subjects were available.

Very few researchers have investigated and published linear speed or agility data on wrestlers. Mirzaei et al. (2009), tested speed with a 40-yard sprint, like the NFL combine. Elite, junior wrestlers performed the sprint in an average of 5.14 seconds. The agility test was a 4 x 9-meter shuttle (Mirzaei, 2009). Average times were 7.6 seconds touching a sensor. No information was captured on the logistics of testing and whether or not the 40-yard times were electronic. There is great likelihood that these tests are conducted routinely with elite male Iranian wrestlers, but the data was not accessible via conventional routes.

Flexibility

During wrestling, the limbs are forced through extreme ranges of motion. When flexibility is limited there may be performance impairments. However, there is no conclusive evidence that flexibility training directly improves wrestling performance.

In Horswill’s research findings, wrestlers had a greater rotation and abduction and adduction of the shoulders than nonathletic controls (1992). While neck flexibility was also high in the wrestlers, wrist flexibility was lower than the non-athletes (Horswill, 1992). Comparing the successful wrestler with the less successful wrestler, it was shown that flexibility might be a discriminating variable (Horswill, 1992). Yoon (2002) reported the flexibility of elite wrestlers is higher than lower level wrestlers.

In Mizraei’s works, he evaluated flexibility on a senior world champion Greco-Roman wrestler (2010). The tests included were: The sit and reach, the shoulder-wrist elevation test and the trunk and neck-elevation test. The latter two tests are essentially tests of extension. Scores were listed on a table with no units of measure leaving them difficult to interpret. Other normative data for elite wrestlers using these tests were not found.

Generally speaking, flexibility of elite male and female wrestlers must be investigated in a comprehensive manner to establish normative values.

Aerobic Power & Capacity

When wrestling matches were 9 minutes long (1976), a much higher emphasis was placed on aerobic power. Coaches were recruiting athletes with VO2 max’s 60-70+ ml/kg/min (Sharratt, 1984). Today, matches are shorter (2 rounds of 3 minutes each, with a 30-second break). Therefore, it is possible that aerobic power is not as critical for match success as previously suggested. According to Zi-Hong’s work, maximal oxygen consumption (VO2 max) does not appear to differentiate between elite female wrestlers at different levels of competition (2013). The capacity to provide energy by means of anaerobic pathways is now considered more critical to performance.

In general, elite male wrestlers have peak V02 values of between 50.4 and 62.4 ml/kg/min (Horswill, 1992). Yoon (2002) reported that the maximal oxygen uptake of national and international male wrestlers taking part in international competition has been shown to be 53 to 56 (ml·kg-1 min-1). An article published by Huber-Wozniak (2009) found an average Vo2 in male elite wrestlers was 59.8 ml/kg/min, and females were 49.7 ml/kg/min. Total oxygen uptake at the anaerobic threshold, expressed as a percentage of VO2 max, was higher in the female wrestlers (Huber-Wozniak, 2009). Higher oxygen utilization at anaerobic threshold might provide useful insight into gender differences between elite male and female wrestlers. At the time of this specific publication, matches could last as long as 7 minutes and 30 seconds.

Elite Chinese female wrestlers in the more recent Zi-Hong study (2013) reported similar findings across weight classes with 41.70 to 55.60 ml/kg/min VO2 max scores. Relative scores were not significantly different between 48, 55 and 63 kg weight classes, but the 72kg weight class was significantly lower.

Both gender sets of data were obtained using a treadmill protocol. However, this evaluative measure might be questionable being that wrestlers may or may not partake in running training sessions and therefore may not be familiar with that modality. When a cycle ergometer was employed with elite male wrestlers (Horswill,1992) reported peak oxygen uptake values of 45.4 – 64.0 ml/kg/min. No published data for elite females is available using a cycle ergometer.

In Zi-Hong’s study (2013), the Elite Chinese female wrestlers also completed a 3,200-meter time trial run. The average time for all weight classes was 14 minutes and 1 second. The 3,200 meter run times were not significantly different between the weight categories. No other data for female wrestlers is available using this field test.

Putting this into perspective with other populations, elite male and female wrestlers have peak oxygen uptake capacities that are average to above average compared with untrained and sprint trained individuals but are below average compared with the endurance athlete.

In reviewing studies comparing the peak oxygen uptake of successful and less successful wrestlers, it appears that oxygen uptake is not a major determinant of success. The Olympic and World Championship medalist wrestlers from China showed no consistent pattern of having the best score in the 3,200-meter run or Vo2 max treadmill test (Zi-Hong, 2013). Horswill et al. (1989) show that at three levels, Olympic, collegiate and scholastic, the peak oxygen consumption is not significantly different between successful and less successful counterparts.
Collectively, aerobic metabolism is an important fundamental pre-requisite to achieve good performance, but it may not be a major determinant of success in all weight categories and genders. However, this is a question that has yet to be clearly answered (Utter et al., 2002). In the 2010 Annual Review of Wrestling Research, top male wrestlers were noted to have VO2 scores over 60 ml/kg/min.

It is also important to note the contribution of central and peripheral fitness to peak oxygen uptake may vary between the upper and lower body. Specifically, peripheral fitness tends to make a larger contribution to peak oxygen uptake for arm cranking than does central fitness. Perhaps peripheral muscular endurance needs to be further and more formally investigated.

Concluding Statement Re: Characteristics

With the current duration of international matches and an emphasis on an aggressive style of wrestling that promotes high point scoring maneuvers in international competition, strength, anaerobic power, and anaerobic capacity are the dominant physical qualities of successful wrestlers (Yoon, 2002).

Collectively, the research indicates that no single physiological parameter in isolation determines elite wrestling performance. However, the strength and power values of Olympic and World Championship medalists are at the upper end of the parameter’s range whereas aerobic power may not separate Collegiate and National level from World (elite) level.

The Puzzle — The Interference Effect

Strength and Conditioning for wrestlers is a huge puzzle, especially when we factor in technical and tactical development, which can also be quite taxing on the athlete. Wrestling requires the development of several qualities simultaneously: Aerobic power, maximal strength, power, muscular endurance, and speed. The adaptations for resistance training, speed training, and endurance training are different and in many instances conflict. Thus, programming strategies run the risk of the interference effect.

Concurrent training, by definition, is “performing aerobic exercise within the same training program as resistance training “ (Bagley, 2016). Wilson (2012) defined it as “the inclusion of resistance training combined with aerobic exercise in a single program.” The “Interference Effect” which is the plausible result of concurrent training, is where adaptations from endurance exercise differ or even conflict with adaptations from strength and power exercise.

Numerous studies have concluded that it is difficult to concurrently develop strength, power, speed and aerobic fitness for several reasons including the tug of war of the both the Nervous and Endocrine systems during the process of adaptation. Several biological theories can help explain the incompatibility of all of these fitness qualities such as: Changes in motor unit recruitment, Residual fatigue, Specific adaptation in the muscles and the nervous system, and Hormonal alterations. This is by no means an exclusive list. What is important to mention here with respect to the research on concurrent training is this: All studies are subject to careful interpretation; the findings and practical application are always subject to the very pertinent question:

Who were the subjects and what conditions were present during the time of data collection?

Adaptation to exercise is directly related to the training stimulus an athlete is exposed to. This is the fundamental premise behind the SAID principle. This is a true, yet an incomplete statement. All biological systems are variable and influenced by a myriad of factors. In order to truly elucidate the effects of a training intervention, athletes must be monitored daily, and the coach must be responsive in his or her intervention, keeping the training objectives in mind without sacrificing the state of the human organism.

Conventional strength and conventional endurance modes of exercise training induce markedly different chronic adaptations when performed as a single modality. It is typical of strength-training programs to involve large muscle group exercises with high resistance and low repetition with the goal to improve the force and power output of skeletal muscle and neural signaling to the involved musculature. Chronic exposure to high-intensity strength training results in muscle cell hypertrophy via increases in protein synthesis and accretion of contractile proteins (Passelergue & Lac, 2012) and improvements in neural drive.

In comparison, exclusive endurance-training programs typically utilize low-resistance, high repetition exercises that involve large muscle groups and are cyclic and repetitive. Muscle tissue responds by degrading myofibrillar protein to optimize oxygen uptake kinetics (Passelergue & Lac, 2012). Chronic adaptations to endurance exercise include increases in aerobic enzyme activity, mitochondrial density, vascularization in the trained muscle bed and improved maximal oxygen uptake (Hunter et al., 1987).

It is, however, important to note that the two are not always mutually exclusive, even when performed on their own. Some forms of strength and endurance training programs may not reflect the above adaptations. Some strength training programs have produced very small, albeit significant increases in VO2 max as well as muscle endurance (Hickson, 1988) and some endurance programs have increased strength and muscle fiber size (Gollnick, 1973). It is not as cut and dry as it may seem.

Numerous studies have highlighted the consequences of the interference effect on maximal dynamic strength, speed running and maximal torque, especially at fast angular velocities (Robineau et al., 2014). Other investigations proposed that these impairments are largely debatable (Robineau et al., 2014). Several studies also highlight improvements in peak oxygen consumption and markers of aerobic capacity (Robineau et al., 2014).

Research, however, rarely reflects the normal training and competition schedules of elite wrestlers. Several studies reviewed in this topic area used untrained subjects, which are not a comparable population to wrestlers. The levels of speed, strength, and power, as well as training experience among highly trained wrestlers, far exceed that of the average recreationally active person.

“The real question lies in whether or not the interference effect has a universal phenomena or if it is very much context specific.”

Concurrent Training Research Review

Hickson began with the first concurrent training study in 1980. His intention was to “investigate how individuals adapt to a combination of strength and endurance training as compared to adaptations produced by either strength or endurance training separately.”

Hickson’s findings demonstrated that “simultaneously training for strength and endurance results in a reduced capacity to develop strength, but did not affect the magnitude of increase in VO2 max.” Delving deeper into the guts of his research included:

  • Only using recreationally active subjects,
  • Using subjects as old as 37 years,
  • Strength training 5x/week,
  • Endurance training 6 times per week,
  • Concurrent training for 10 weeks straight.
  • Both strength and endurance qualities were trained on the same day and only separated by 2 hours of rest.
  • There was no indication in the methods of which quality was trained first.

Pre and post testing measures were valid and reliable but there were no measures of the force-velocity relationship in this study. Although Hickson’s works opened the investigative gates for this area of study, it is difficult to apply his research findings to highly trained athletes who require high levels of power to be successful at the world stage in their sport.

The reality is, combining methods of strength and power training with conditioning sessions is commonplace for a strength and conditioning coach. Much of the literature suggests that under concurrent training conditions, the amount of work that can be performed in each strength-training session could be negatively impacted by residual fatigue from prior endurance training. This may result in compromised strength improvements over the course of a training program.

The fatigue hypothesis it is actually quite difficult to interpret as the cause of such fatigue could be based on a variety of physiological factors such as hydrogen ion accumulation and subsequent blood pH change, depletion of muscle energy supply, neural fatigue, or structural damage to muscle fibers. This is beyond the scope of this article but should be acknowledged with respect to physiological impairments and timelines.

Sale’s work (1989), conducted over 20 weeks examined the long-term effects of variations of recovery periods between strength and aerobic training sessions on strength from both same-day and alternate-day concurrent training. Although the training programs were identical, alternate day training showed significantly greater improvements in maximal leg press strength than same-day training at both 10 and 20 weeks. Their findings suggest 24 hours of recovery following aerobic training (Sale, 1989).

Abernethy (1993) demonstrated that isokinetic strength was impaired for up to 4 hours following high-intensity aerobic interval training. It could be assumed that isotonic strength would be impaired for up to 4 hours as well (Abernethy, 1993). These findings suggest compromises in strength may last up to 8 hours post-aerobic training, which further supports a longer recovery period between sessions.

Other studies (Sporer and Wenger, 2003) provide more insight on residual fatigue from prior aerobic (endurance) training. Their results indicate aerobic training at a variety of durations and intensities negatively impacted both isotonic and isokinetic strength performance at both 30 minutes and 4 hours post-session (Sporer and Wenger, 2003). It was highlighted when recovery from aerobic exercise was increased to 8 hours, strength performance was not compromised (Sporer and Wenger, 2003). Maximal aerobic training appears to similarly affect strength performance as does submaximal aerobic training when equated for duration. Although aerobic training primarily recruits slow-twitch (ST) fibers, as the intensity of training increases, FT muscle fibers are recruited and taxed to a greater extent (Sporer and Wenger, 2003). It would be expected, then, that higher-intensity aerobic training would result in a greater amount of fatigue prior to strength training. However, no effect of type of aerobic training was shown (Sporer and Wenger, 2003). This provides the coach with a wide range of training intensities to prescribe when aerobic training must precede strength training (Sporer and Wenger, 2003).

Research conducted by Wilson et al. (2012) identified which prescriptive components of endurance training (Mode, Duration, Frequency) were detrimental to resistance training outcomes. A meta-analysis of 21 studies was conducted. As a large portion of the literature suggests, aerobic capacity was not inhibited with concurrent training as compared to endurance training alone (Wilson et al., 2012). Wilson’s meta-analysis focused on the training outcomes: strength, hypertrophy, and power. A study design criterion, such as the use of trained subjects, was not considered. However, some conclusions are worth discussing.

Wilson et al. (2012) found that modality (type of endurance stimulus, i.e., biking) takes first place on the interruption in strength and power adaptations. Decrements were seen in strength and hypertrophy when strength training was combined with running versus cycling (Wilson et al., 2012). It should be noted though that running resulted in a larger decline of fat mass (Wilson et al., 2012).

Interference effects were also primarily body part specific as decrements in strength and power were seen in lower body exercises versus upper body exercises after a lower-body dominant endurance activity was performed (Wilson et al. 2012). It could be hypothesized that upper-body endurance training could negatively impact upper body strength development.

Overall training volume accounted for a small portion of the interference effects (Wilson et al., 2012). Volume is typically defined as the total amount of work completed in a training session. For endurance training this is usually based on time at particular intensities. This meta-analysis also suggested that shorter-duration, high-intensity sprinting does not result in decrements in strength and power (Wilson et al., 2012). However, specific prescription examples were not given. The optimal amount of endurance volume, when trained concurrently with strength, appears to be less than 30 minutes per session, 3 times or less per week (Wilson et al., 2012).

Much of the research investigates concurrent training prescription on strength, hypertrophy and aerobic capacity outcomes. However, power, may, in fact, be the most susceptible quality. While Hakkinen et al. (2003) reported similar increases in maximum EMG activity in both concurrent trained and strength trained only individuals, increases in rate of force development and associated rapid neural activation of trained skeletal muscle were only seen in the strength trained individuals. It was suggested, “the addition of endurance training may have suppressed the improvement in rapid neural activation in those who trained concurrently” (2003).

Jones et al., (2015) also found inhibition of lower-body power development after 3 and 6 weeks of concurrent training when compared with strength training alone indicating that power phenotypes are more susceptible to interference than maximal strength indices. Counter-movement jumps, rate of force development and peak torques at high velocities were all negatively impacted as a result of combing strength and endurance training, yet maximal strength remained uninhibited (Jones et al.,. 2015).

However, these findings are not consistent with other research (O’Sullivan, 2013). O-Sullivan suggests that concurrent training in well-conditioned athletes may not attenuate neuromuscular adaptations to strength training. In fact, intelligent sequencing of training may be the key to allowing elite athletes to perform concurrent strength and endurance training without negative impacts on anaerobic power performance (Abernethy, 1993).

Programming Considerations for the Elite Freestyle Wrestler

  • One must prioritize fitness components into the training plan, possibly emphasizing only one or two components in a mesocycle.
  • Everything counts as training stress. It is best practice to monitor and quantify all training volume loads, including wrestling practices and S&C sessions.
  • In terms of component order, perform strength work well before endurance work (24 hours is ideal). Do not program strength training after endurance training.
  • If 2 components of fitness must be trained on the same day, separate strength training sessions and endurance sessions by a minimum of 8 hours.
  • Do not program strength training after wrestling practice, unless it is only technical practice. In this case, rest a minimum of 4 hours.
  • Directly after wrestling practice an athlete may perform low-intensity endurance training as a means of recovery.
  • Avoid adding extra endurance sessions for the purpose of weight cutting. Instead, work with a Registered Dietician to achieve this goal.
  • Select a modality of endurance exercise that closely resembles the DEMANDS of the sport to avoid occurrence of competing adaptations.
  • Avoid long duration endurance exercise; Keep sessions under 30 minutes total training time.
  • Endurance exercise should be performed no more than 3 times per week.
  • Running might be a good modality for athletes seeking to lose bodyfat. However, it might be a poor choice for heavier athletes as it is high impact and has a large eccentric component associated with muscle injury and longer recovery timelines.
  • Select endurance exercise where one can maintain a very high pace (work rate) to avoid loss of muscle mass, strength and power.
  • Keep lower body lifting sessions to 2 days per week, separated by 48-72 hours.
  • Create a split routine if endurance (conditioning sessions) cannot be programmed away from strength sessions. For example, perform explosive medicine ball throws, bench press and back exercises with a high-intensity cycling interval session on the same day.
  • Be a flexible coach. At the end of the day, to be a great wrestler, one must wrestle. Although strength and conditioning does have a big role in the athlete’s development, it does not replace the valuable time spent on the mats.
  • Work with wrestling coaches to train specific energy systems at practice in a more competitive and sport-specific environment. Work together to create the most ideal training schedule for your athlete.

Future Directions

Experienced coaches who work with highly trained strength-power athletes would question most of the practical application of the research on concurrent training to date as it has often been conducted on untrained subjects for too short of an intervention period. Thus, research findings will be more helpful when the subjects tested are trained and include technical and tactical training as part of their overall training plan. With experienced wrestlers, the use of RPE during both practice and matches combined with duration can give investigators good insight into total volume loads at wrestling practice. Different technical skills practiced by the wrestler elicit very different levels of muscular effort, so this must be considered in the overall training program. Practice conditions can be classified as high intensity or low intensity: Live go’s and match specific work to rest ratios are all high intensity. Technical, slower pace partner work might be considered low intensity. Heart rate data might not be helpful as a means to categorize intensity due to the nature of the work. If we consider sport-specific drills and practice settings as specific modalities of endurance training, we might be able to evaluate their impact on strength, speed and power outcomes.

Finally, a more holistic approach to adaptation must also be examined with mention of life stress levels, sleep patterns, nutrition practice, relaxation strategies and other important factors that can make or break the adaptation process. Research on concurrent training so far has ignored these seemingly outside factors and their impact on recovery. Although case study research is often frowned upon for lack of statistical significance, perhaps this is the new frontier in examining a more realistic study design and training outcomes.

Final Message

Understanding the demands of the sport of wrestling is of huge value to the strength & conditioning coach and sport scientist. The application of this knowledge must incorporate all dimensions of physiology, biomechanics and sport medicine with the combined intuition and coaching ability of the elite coach. A comprehensive review of fatigue models and Hans Selye’s works is a terrific place to begin general investigation of the process of adaptation. The study and dissection of training practice of sprinters, throwers, jumpers, gymnasts, weightlifters, GS lifters, rowers, swimmers and endurance athletes also helps one understand the training process. It is from studying these less chaotic or purist sports that one can begin to understand how the athlete may or may not adapt to a training program that involves the development of several physical qualities at once (Tsatsouline, Personal Communication, 2016).

“Sport science research does not provide all of the answers. We must maintain our senses and humanity in all that we do as coaches.” — Coach Bott


Please share so others may benefit.

References

  1. ABERNETHY, P.J. Influence of acute endurance activity on isokinetic strength. Journal of Strength & Conditioning Research 7:141–146. 1993.
  2. ABERNETHY, P.J., AND B.M. QUIGLEY. Concurrent strength and endurance training of the elbow flexors. Journal of Strength & Conditioning Research 7:234–240. 1993.
  3. BAKER, D.G., AND NEWTON, R.U. Adaptations in upper-body maximal strength and power output resulting from long-term resistance training in experienced strength-power athletes. Journal of Strength & Conditioning Research 20 (3): 541-546, 2006.
  4. BARBAS, I ET AL. Physiological and performance adaptations of elite Greco-Roman wrestlers during a one-day tournament. European Journal of Applied Physiology 111: 1421-1436. 2011.
  5. BELL, G.J., S.R. PETERSEN, H. QUINNEY, AND H.A. WENGER. Sequencing of endurance and high-velocity strength training. International Journal of Sports Medicine 13:214–219. 1988.
  6. BELL, G.J., SYROTUIK, D. et al. Effect of concurrent strength and endurance training on skeletal muscle properties and hormones concentrations in humans. European Journal of Applied Physiology. 81: 418-427. 2000.
  7. CALLAN SD, et al. Physiological profiles of elite freestyle wrestlers. Journal of Strength & Conditioning Research 14(2): 162–169, 2000.
  8. CHILIBECK, P.D., SYROTUIK, D and BELL, G.J. The effect of concurrent strength and endurance training on quantitative estimates of subsarcolemmal and intermyofibrillar mitochondria. International Journal of Sports Medicine 23: 33-39. 2002.
  9. DOCHERTY, D., AND B. SPORER. A proposed model for examining the interference phenomenon between concurrent aerobic and strength training. Sports Medicine 30:385–394. 2000.
  10. DUDLEY, G.A., W.M. ABRAHAM, AND R.L. TERJUNG. Influence of exercise intensity and duration on biochemical adaptations in skeletal muscle. Journal of Applied Physiology 53:844–850. 1982.
  11. DUDLEY, G.A., AND R. DJAMIL. Incompatibility of endurance and strength training modes of exercise. Journal of Applied Physiology 53: 1446–1451. 1985.
  12. GARCIA-PALLERAS J et al. Physical fitness factors to predict male Olympic wrestling performance. European Journal of Applied Physiology 111: 1747–1758, 2011.
  13. GOLLNICK, P.D. Metabolism of substrates: energy substrate metabolism during exercise and as modified by training. Symposium: Metabolic and Nutritional Aspects of Physical Exercise. April 11, 1983.
  14. HAKKINEN, K., ALEN, M., KOMI, P.V. Neuromuscular, anaerobic and aerobic performance characteristics of elite power athletes. European Journal of Applied Physiology 53: 97-105. 1984.
  15. HAKKINEN K, ALEN M, KRAEMER W et al. Neuromuscular adaptations during concurrent strength and endurance training versus strength training. European Journal of Applied Physiology 89: 42-52. 2003.
  16. HENNESSEY, L.C., AND A.W.S. WATSON. The interference effects of training for strength and endurance simultaneously. Journal of Strength & Conditioning Research 8:12–19. 1994.
  17. HORSWILL C.A. Applied physiology of amateur wrestling. Sports Medicine 14(2). 114-143. 1992.
  18. HORSWILL C.A. SCOTT, J.R. ET AL. Physiological profile of elite junior wrestlers. Research Quarterly for Exercise and Sport. 59 (3). 257-261. 1988.
  19. HICKSON, R.C. Interference of strength development by simultaneously training for strength and endurance. European Journal of Applied Physiology 45:255–263. 1980.
  20. HUBNER-WOZNIAK, E. KOSMOL, A AND GAJEWSKI, J. Aerobic fitness of elite female and male wrestlers. Biology of Sport. Vol 26(4): 339-348. 2009.
  21. HUNTER, G. DEMMENT, R and MILLER, D. Development of strength and maximum oxygen uptake during simultaneous training for strength and endurance. The Journal of Sports Medicine and Physical Fitness. 27 (3), 1987.
  22. KRAEMER WJ, FRY AC, et al. Physiological and performance responses to tournament wrestling. Med Science Sports Exercercise 33: 1367–1378, 2001.
  23. KRAEMER WJ, Vescovi JD, and Dixon P. The physiological basis of wrestling: Implications for conditioning programs. Strength & Conditioning Journal 26: 10–15, 2004.
  24. KRAEMER, W.J., J.F. PATTON, et al. Compatibility of high-intensity strength and endurance training on hormonal and skeletal muscle adaptations. Journal of Applied Physiology 78:976–989. 1995.
  25. LEVERITT, M., AND P.J. ABERNETHY. Acute effects of high-intensity endurance exercise on subsequent resistance activity. Journal of Strength & Conditioning Research 13:47–51. 1999.
  26. LEVERITT, M., P.J. ABERNETHY, B.K. BARRY, AND P.A. LOGAN. Concurrent strength and endurance training: A review. Sport Medicine 28:413–427. 1999.
  27. LEVERITT, M., H. MACLAUGHLIN, AND P.J. ABERNETHY. Changes in leg strength 8 and 32 hours after endurance exercise. Journal of Sport Science 18:865–871. 2000.
  28. MIRGHANI, S. ET AL. Influence of strength, endurance and concurrent training on the lipid profile and blood testosterone and cortisol response in young, male wrestlers. Baltic Journal of Health and Physical Activity. 6 (1) 7-16. 2014.
  29. MIRZAEI, B AND LOTFI, N. Physiological profile of a world wrestling champion. Presented at the 2010 Annual Review of Wrestling Research.
  30. MIRZAEI, B, CURBY, D ET AL. Physiological profile of elite Iranian junior freestyle wrestlers. Journal of Strength & Conditioning Research 23(8). 2339-2344, 2009.
  31. MIRZAEI, B. GHAFOURI, A. A physiological profile of Iranian senior Greco-Roman wrestlers. Journal of Sport Sciences. 3(5). 8. 2007.
  32. MURACH, K and BAGLEY, J. Skeletal muscle hypertrophy with concurrent exercise training: contrary evidence for an interference effect. Sports Medicine March 2016.
  33. O’SULLIVAN, D. Concurrent strength/power and endurance training of players in elite football codes: A brief review. Journal of Australian Strength & Conditioning. 21(1), 52, 2013.
  34. POPADIC, O.; GACESA JZ, et al. Maximal anaerobic power test in athletes of different sport disciplines. Journal of Strength & Conditioning Research 23 (3): 751-755, 2009.
  35. ROBINEAU et al. Specific training effects of concurrent aerobic and strength exercises depend on recovery duration. Journal of Strength & Conditioning Research 30(3), 672-683, 2014.
  36. SALE, D.G., J.D. MACDOUGALL, I. JACOBS, AND S. GARNER. Comparison of two regimens of concurrent strength and endurance training. Medical Science in Sports and Exercise 22 (3). 1989.
  37. SALE, D.G., J.D. MACDOUGALL, I. JACOBS, AND S. GARNER. Interaction between concurrent strength and endurance training. Journal of Applied Physiology 68:260–270. 1990.
  38. SHARRATT, M.T. ET AL. A physiological profile of elite Canadian freestyle wrestlers. Canadian Journal of Applied Sport Science 11(2): 100-105. 1986.
  39. SILVA, R. ET AL. Concurrent training with different aerobic exercises. International Journal of Sports Medicine 33: 627-634, 2012.
  40. SPORER B and WENGER, H. Effects of Aerobic Exercise on Strength Performance Following Various
Periods of Recovery. Journal of Strength & Conditioning Research 2003, 17(4), 638–644. 2003.
  41. UTTER, A.C., M.H. STONE, H. O’BRYANT H, R. SUMINSKI, AND B. WARD. Sport-seasonal changes in body composition, strength, and power of college wrestlers. Journal of Strength & Conditioning Research 12:266–271. 1998.
  42. UTTER, A.C. et al. Physiological profile of an elite freestyle wrestler preparing for competition: a case study. Journal of Strength & Conditioning Research 16(2) 308-315. 2002.
  43. WILSON, J et al. Concurrent training: A meta-analysis examining interference of aerobic and resistance exercises. Journal of Strength & Conditioning Research 26 (8). 2293-2307. 2012.
  44. Yoon J. Physiological profiles of elite senior wrestlers. Sports Medicine 32: 225–233, 2002.
  45. ZI-HONG H, LIAN-SHI F et al. Physiological profiles of elite Chinese female wrestlers. Journal of Strength & Conditioning Research 27(9): 2374-2395. 2013.

The post Concurrent Training: Implications for Freestyle Wrestling Performance – Striving for Optimal Training Practice appeared first on Freelap USA.

The Horizontal Jumps: Technical Training for the Long Jump

$
0
0

Mitchell Watt Long Jump

By Nick Newman MS

Technical Training

Technical training is an important element in any training program. For a long jumper, it can take many forms. Some aspects are subtle and, at first glance, may not appear related to the technical model. I believe, however, that all training components can be linked in some way, and it’s simply a matter of perspective and deeper thinking that allows us to make the connection.

Throughout this article, I will discuss areas of technical training that I believe essential for the development of long jumpers. I will categorize each element and provide a clear understanding of how to build a comprehensive technical training system. I will also include a guide to long jumping technique and discuss important technical aspects as they pertain to particular drills and training methods.

Developing the Approach Run

I will begin with the approach run, the most important aspect of the long jump, from both a technical and performance perspective.

More than 95% of the distance achieved during the long jump is determined by the speed generated during the athlete’s approach. A successful approach run is complex and involves several distinct components. I’ll focus on the technical aspects of each training component.

Acceleration

As an absolute quality, the ability to accelerate plays an important role for maximum velocity. During an approach run, where most athletes are limited to 18-23 strides (35-55m), acceleration technique is considerably important. The goal is not only to achieve near maximum velocity but to do so in rhythm with correct posture and timing.

A jumper must accelerate smoothly and relaxed for successful transitioning during the final 10m and through takeoff. The ability to accelerate fast and relaxed while demonstrating upright running mechanics is key and requires considerable practice.

Depending on the time of year, acceleration sessions generally occur 2-3 times per week. Running at lower intensities is included on other days and serves well for rhythm, technique, and recovery.

Acceleration sessions require repeated bouts of sprinting over 20-40m performed at 95-100% effort. Relaxation and smooth sprinting mechanics are key and must transfer to approach running.

Max Velocity

Our goal is to develop athletes who will reach high maximum velocities without straining or demonstrating inefficient sprint technique.

As stated, horizontal velocity is the largest determining factor when achieving elite distances. Due to the technical aspects of the takeoff and flight phases, however, it is rarely possible or advantageous for athletes to reach 100% of maximum speed during their approach. Therefore, the relative approach speed becomes very valuable.

We know the approach velocities required to achieve certain distances, and we know the relationship between horizontal velocities and takeoff angle. Through maximum speed development, we can create a speed buffer. This buffer allows the athlete to achieve high velocities while maintaining optimal technique and focus without straining or feeling out of control.

Developing maximum velocity starts with the ability to both accelerate efficiently and maintain a high level of coordination and synchronicity over a 35-55m distance.

Fly sprints are particularly useful when focusing on max velocity mechanics and high-speed output in isolation. After a period of acceleration work, I gradually introduce fly sprints to the program. I like to use a 35m gradual acceleration (25m for women) into a 10-30m zone. I’ve found that 95-98% of max velocity can be achieved via a gradual (slightly sub max) acceleration while maintaining a smooth and relaxed sprinting technique. Fly sprints, my favorite method, closely resemble a long jumper’s approach.

I generally progress the speed program by including Sprint–Float–Sprints (SFS). SFS creates the perfect bridge between fly sprints and special speed endurance development that occurs next and last in the speed progression. I start around 90m total length and progress to 150m. The total length is broken down into sections. For example, a 90m SFS may include a 30m acceleration followed by a 30m float section followed by a final 30m sprint.

It’s important to understand the purpose and requirements of the float section. During the float, I cue the athlete to switch off the burners while maintaining as much speed as possible. The approach run requires relaxed and controlled speed. Achieving high speed in this manner is a skill, and the practice of smooth accelerations, fly sprints, SFS, and slower extensive tempo running sessions all contribute to development.

The final progression involves special speed endurance work. This follows two basic formats, one for short speed endurance and one for long speed endurance. A short speed endurance protocol could be 2x5x40m sprints at 90% with 2 min and 6 min recovery. One protocol for long speed endurance could be 4x150m sprint at 90% with 8 min recovery. Developing speed endurance enhances an athlete’s freedom when running at high speeds; another method to help improve high velocity sprinting while relaxed. Without specifically discussing sprint technique, we can see the common technical themes throughout all speed development methods as they relate to the long jump approach.

Approaches

Approach development becomes the focal point throughout the competitive period and special training phases. Here, the countless hours developing technique and sprinting speed are put to practical use.

The most important technical cue word is rhythm. Rhythm has a personal touch. A successful approach has a steady and consistent build of energy, and achieving this can be very difficult. It requires a certain connection to the approach and a high-level kinesthetic awareness. Both can be learned and practiced.

Approach development starts early in the program and should be a conscious thought during build ups, strides, accelerations, and fly sprints. Rhythmic sprint drills can also teach the gradual build.

Runway work is essential, and the volume and frequency of runway practice increase throughout the preparation and competition phases. Generally I start developing rhythm away from the runway because the takeoff board can be distracting in the early phases. After the initial rhythm isolation and transitioning and takeoff work, I gradually blend everything together via a combination of drills, short approach jumps, and full approach run-throughs.

Specific technical aspects of the approach are addressed in various ways because there are several components to consider. The primary areas of focus include:

  • Number of approach strides
  • Starting method
  • Approach rhythm and style

Characteristics of good approach running include a tall posture, an elastic bouncy stride with a high front side action, and large overall amplitude. Ideally an athlete demonstrates an active build with no wasted strides. Strides are powerful, dynamic, and rhythmic. Correct energy expenditure is essential, and allowing momentum to carry an athlete is a specific skill. Throughout the season, these aspects are discussed and practiced hundreds of times.

I determine approach length and stride number largely based on the athlete’s ability to achieve their highest approach speeds. I decide this regardless of whether the athlete can successfully transition and takeoff at that particular speed. Maximum relative approach speed gives athlete the greatest chance of success and they will develop the ability to handle their fastest approach speeds over time. Optimal stride number often can be determined from acceleration and fly speed tests performed regularly throughout the preparation period.

Having determined approach stride number, we begin to develop an approach style. I prefer to use a similar approach style. Ideally, athletes practice a gradual and smooth acceleration through the board with specific stride characteristics. There are athletes, however, who have a strong ability to maintain speed without technical breakdown. These athletes may benefit from a slightly different approach rhythm. An altered starting method and more aggressive acceleration style may work best. It’s very important to experiment to determine which method works best for each individual. In this video, Carl Lewis demonstrates an ideal approach rhythm and running style for horizontal jumpers. Seoul 1988 Olympics.

Developing Steering, Accuracy, Control

I am a huge believer in approach skill and board accuracy. I mention the two separately because they are very different. Many jumpers have excellent approach accuracy and consistency but poor board accuracy resulting in a high fouling percentage. The consistent 1-inch fouler is extremely common among all levels in the horizontal jumping events. For those that fall into this category, I believe the issue is psychological.

Several common practices exist that create a fouling mentality, and I use several training methods to help combat the issue. I want to stress that these training methods are effective only if athletes make a conscious effort and demand the execution of legal jumps. Fouling is a psychological choice.

Here are psychological factors that contribute to fouling.

Psychological Factors Leading to Fouling
Not appreciating legal jumping as a consciously learned skill
Focusing on distance during technical sessions
Lacking discipline and focus during short approach and full approach sessions
Measuring jumps from the foul mark during technical sessions
Over-arousal during competition settings

Many jumpers do several, if not all, of the above. Coaches often believe fouling requires moving the starting mark back a few inches. Sure, some athletes need more room to execute their ideal running style and rhythm and should move back their starting marks. But if technique and rhythm are ideal and an athlete is fouling by a close margin each time, moving the starting block simply takes the responsibility away from the athlete. This basically allows athletes to leave fouling, or legal jumping, to chance.

Here are several factors that contribute to legal jumping and approach and board accuracy.

Key Factors Contributing to Legal Jumping
Arousal control
Eyes fixed on the takeoff board throughout approach run (practiced)
A consistent starting method (practiced)
A consistent rhythm throughout (practiced)
Consistent foot placements during the first 6 strides (practiced)
Consistent foot placements during middle section of approach (practiced)
Discipline to jump legal (practiced)
Spatial perception abilities at speed (practiced)
Focus and targeting abilities at speed (practiced)

Developing Approach Accuracy

Approach accuracy needs considerable focus throughout the yearly training calendar. I’ll describe important practices to consider during technical training.

Neither approach nor board accuracy is a blind act. They both require deliberate strategies and the use of visual guidance. In my experience, one of the more difficult habits to develop among jumpers is maintaining eye contact with the board. Maintaining visual focus on the target throughout all but the approach’s final stride significantly increases board accuracy.

1) Establishing a Phase 1 Mark

The approach is sectioned into three phases. The first two phases are controlled, deliberate, and practiced hundreds of times. For simplicity, a 20-stride approach for an elite male jumper will require a phase 1 mark at step 6. I like long powerful strides to establish the beginning rhythm of the approach run. I believe aggressive and long ground contacts are better for establishing a consistent rhythm. The athlete must hit the 6 step mark every time during all approach runs and jumps, both short and full.

2) Establishing a Phase 2 Mark

Phase 2 is the final controlled portion of the approach and sets up the all-important final 6 strides toward the board. The 14th stride contact establishes the phase 2 marker. Generally, since the athlete’s eyes are fixed on the takeoff board during this phase, the marker is for the coaches.

Consistency and accuracy during the first two phases will significantly increase effective steering during the final phase. Less error early equals less adjustment later.


Horizontal Jumps: less error early equals less adjustment later.
Click To Tweet


Develop Board Accuracy and Steering

Now that we understand what contributes to the fouling epidemic and how to fix it, we can discuss drills and training methods to develop the habit and skill of legal jumping.

To enhance the learning effect, I’m a big believer in practicing skills in various ways. Board accuracy is no different. Increasing the need to make approach adjustments forces the athlete to cognitively engage in the process of targeting.

1) Full and Short Approach Jumping (Varied Start Method)

During the Varied Start Method, the athlete first establishes an accurate approach mark, one where they can consistently hit the board with a rough variability of 10-20cm. With the starting mark established, the coach starts the athlete’s approach from a different mark, either forward or back within a 30-60cm range. From this new starting mark, the athlete is expected to maintain at least the 10-20cm board accuracy.

2) Full and Short Approach Jumping (Varied Targeting Method)

The Varied Targeting Method also promotes cognitive board awareness. Here the athlete starts the approach from an accurate starting mark and receives specific board targeting instructions. For example, during attempt 1 they’re asked to strike 30cm before the board, and during attempt 2 they’re asked to strike with a toe on the board. Coaches can use many variations.

3) Short Approach Jumping (Forced Legal Method)

During the Forced Legal Method, the athlete has no option to foul because the foul portion of the board is blocked. I’ve placed bright cones along the board’s fouling section to prevent the athlete from hitting it. Wood or other barriers can be used. It may sound dangerous, but in my experience, every athlete hits the legal portion of the board if the option to foul no longer exists. This echoes the fact that fouling is largely psychological.

4) Continuous Hurdle Jumps

I find continuous takeoff drills great for developing rhythm, timing, and elastic qualities. Randomly changing hurdle position forces the athlete to develop awareness and, over time, the ability to instantly adjust stride length with minimal loss of speed, rhythm, and timing.

These 4 methods are my go-to methods for working on board accuracy skill. At the very least, they can help shift focus from jumping distance to technique. But I don’t use them with all athletes, as some tend to overanalyze and the methods become detrimental. If the athlete has great discipline and focus, none of the methods are needed.

Developing the Takeoff

The Takeoff Model

The takeoff cannot occur without the penultimate stride. The two are essentially linked, and every action that occurs with either stride affects the other. We cannot talk about one without talking about the other. Therefore, we shouldn’t practice one without practicing the other. Certainly, the two have their own distinct characteristics, but it’s their connection that makes the technique whole. We should only isolate the movements for absolute beginners.

Here are my key characteristics for the penultimate stride and takeoff as well as commonly seen errors.

Key Characteristics of the Penultimate Stride
Dorsiflexed ankle prepares for flat foot contact
Quick punching stride directly under hip avoids deceleration
Aggressive hip displacement past plant foot achieves active reflex toward free leg drive at takeoff
Hips lower some after penultimate plant and very quickly rise at takeoff plant
Torso posture remains vertical and avoids shoulder rotation
Head remains neutral

Common Errors of the Penultimate Stride
Breaking or decelerating into the penultimate stride
Performing a glide step into the penultimate stride
Pushing too long into the takeoff causing a gliding step and deceleration
Excessive lowering of the hips
Shoulder dip or rotation before takeoff
Heel recovery of takeoff stride remains high
A lateral step leading to poor execution of free leg

Key Characteristics of the Takeoff Stride
Stride is the fastest and shortest stride of the approach run
Takeoff foot plants board slightly ahead of hip
Flat foot contact with takeoff leg is as rigid and straight as possible
At point of plant, active downward and backward straight leg pawing action occurs
An active hinging action of the plant foot occurs from flat foot to toe-off
Hip displacement occurs before plant foot leaves
Cue for hip displacement: hold onto the board to achieve great glute and hamstring involvement during takeoff
A powerful free leg action occurs at takeoff with free leg swinging forward and upward and held for a split second at the parallel thigh position

Common Errors of the Takeoff Stride
Excessive reaching at takeoff
Free leg drives across the body instead of forward
Poor hip displacement, steep takeoff angle
Excessive bending of plant leg
Shoulder dip or rotation before takeoff
Poor head alignment throughout takeoff

Takeoff Specific Drills

The following drills are excellent for teaching and establishing the correct movement programming and timing sequences to achieve these technical aspects. I will discuss how and where to implement these drills later in the article.

  • Standing Penultimate: Penultimate leg bent at knee up, land with heal lead, roll on and off foot
  • Continuous Knee Drive Drill: Drive free leg knee up and down with support leg stiff hopping forward
  • 1 Step Takeoffs: Continuous takeoffs with 1 running step in between
  • 3 Step Takeoffs: Continuous takeoffs with 3 running steps in between
  • 5 Step Takeoffs: Continuous takeoffs with 5 running steps in between
  • Alternate Easy Skip with Aggressive Skip: Drive knee on aggressive skip like a takeoff
  • Power Skips: Alternate jumps working on knee drives
  • Mini Hurdle Takeoffs: Work on penetration past hurdle
  • High Hurdle Takeoffs: Work on vertical components of jump
  • Penultimate Step Box Drill: Run penultimate off low box onto takeoff and jump
  • S/L Depth Takeoff: Drop from low box into takeoff action
  • S/L Depth Takeoff with Preceding Running Strides: As above with a run onto the box
  • Short Run Jumps with and without Landing with and without Weight Vest: 4, 6, 8, 10, 12, etc., strides
  • Rhythm Runs with a Pop Up: 70-80% runs with a pop up at end


Video 2. Ivan Pedroso demonstrates the ideal long jump takeoff.

Developing the Flight

The Flight Model

Don’t overcomplicate the ideal flight action. The 2-and-a-half hitch kick is a poor choice for almost all jumpers. Simply put, few jumpers historically have achieved ideal landing positions while performing this technique.

The flight’s purpose is to counter forward rotation and set up an ideal landing position. In this regard, the flight can greatly impact the outcome of a jump. I find that a basic hang or 1-and-half hitch is ideal. Of the two, I prefer the hang; it’s easier to coordinate the ideal landing position during the simplest flight technique.

Here are the key characteristics of the flight phase as well as commonly seen errors.

Key Characteristics of the Flight Phase
After the initial free leg swing, the leg begins a cycle and extends downward
As arms naturally cycle from takeoff, the same arm as free leg extends vertically as the free leg extends downward
Both arms reach high above the head and maintain vertical positions through the flight
At the top of the flight, both legs position forward with knees moving upwards toward chest
While maintaining a vertical torso with arms up and forward, the hips position forward with legs extending far ahead of the COM
Torso remains vertical and arms up while heels make contact with the sand

Common Errors of the Flight Phase
Ending knee drive too early
Diving torso forward during flight
Sideways lean throughout flight
Poor timing of leg shoot
Poor coordination of limbs

Flight Specific Drills

Because the recommended flight drills require the preceding takeoff, we can use the majority of the takeoff drills listed. Raising the takeoff board during short approach jumps allows the athlete to achieve height with less effort during takeoff. This option is beneficial when more repetitions are required to work specifically on mechanics. Otherwise, I don’t use this option regularly with my athletes.

Developing the Landing

The landing phase changes more competition outcomes than fouling in my opinion. Many factors lead to a successful landing, and it’s not an easy technique to consistently perform correctly. As mentioned earlier, the execution of the flight determines much of what is achieved during the landing.


Horizontal Jumps: execution of the flight determines much of what is achieved during the landing.
Click To Tweet


Understanding how an optimal landing looks is an important starting point because many jumpers or coaches don’t appear to know or care.

The Landing Model

A successful long jump takeoff requires great hip displacement past the takeoff board. Obviously long legs help greatly, and this concept transfers to the landing. If great hip displacement occurs at both takeoff and landing, the jumper reduces the flight distance. This becomes increasingly important the longer the athlete jumps.

So, for the landing, the athlete must achieve the correct position before contact with the sand. Here we want a vertical, or slightly leaned back, torso with hips ahead of the shoulders. This allows the knees to fully extend before contacting the sand with the heels. At the instant of the heel strike, the hamstrings and glutes aggressively contract. This action combined with forward momentum forces the athlete’s hips to travel past the point where the heel strike occurred.

The correct landing action is essential but, without perfect timing, many errors occur. Here are the key characteristics of a good landing and commonly seen errors.

Key Characteristics of the Landing Phase
Tall upright torso through the point of heel strike
Arms up and forward throughout final stages of flight
Hips pushed forward
Legs extend slightly before sand contact
Active downward strike with the heels in the sand
Hamstrings and glutes contract to pull athlete’s hips through the sand contact point

Common Errors of the Landing Phase
Forward rotation while approaching landing
Premature dropping of the feet
Sideways lean creating opposite foot drop
Passive foot strike creating butt contact with the sand

Landing Specific Drills

As with flight technique, practice methods that isolate the landing serve little to no purpose past the beginning stages.

Very early in development, several method drills can establish awareness of certain technical goals and expectations. Sitting on a chair while actively heel striking the sand, for example, can teach a young athlete to extend their legs and engage the hamstrings during the movement. We can progress this to a standing long jump exercise practicing the same movement. These type of drills, however, will have little carry over to event specific requirements if we don’t implement whole practice jumping.


Video 3. Marquis Dendy demonstrates one of the best flight and landing combinations today.

The Technical Training System

During this article, I’ve discussed many training methods, drills, and exercises that help develop specific technical qualities. I’ve also detailed technical characteristics, common errors, and coaching cues.

In the world of Track and Field, drills, and there are hundreds of them, are the centerpiece of many training programs. Coaches will spend hours painstakingly researching, practicing, and creating drills designed to teach technical aspects of the event.

Unfortunately drills are often practiced with little to no realization of the drill’s actual purpose. Drills can be as irrelevant and meaningless as they can be masterful for skill acquisition. The most important aspect of any drill is how the coach or athlete identifies and connects fundamentals to the overall goal.


Drills can be as irrelevant and meaningless as they can be masterful for skill acquisition.
Click To Tweet


A drill by itself isn’t enough to teach a skill. Awareness must be established early in technical development about the purpose, goals, and outcomes desired from all drills and technical practices. As long as connections are made between each drill and the event’s fundamental requirements, we may see successful transfer.

The Periodization of Technical Training

Having established the ingredients of technical training, we must address long-term planning and progression. Important aspects of successful technical programs are the progression and timing of technical exercises and practice types. Just like speed, strength, and power development, technical training should follow a periodized plan. Basically, we should divide technical training into training phases that blend seamlessly with one another over time. Each phase will build on another, gradually shifting toward the big picture of the event specific requirements of speed, timing, and psychological stress.

General Preparation

Technical training begins, as does physical training, during the General Preparation Phase. Here we introduce technical models accompanied by partial drills and preparatory exercises. Video analysis work begins to provide a deep understanding of the end goal. I also include weekly visualization sessions of the whole skill (full event situation technique) during all phases of the year in gradually increasing and eventually decreasing amounts.

During this time, technical training’s purpose is to introduce and teach, not to spend an exhaustive amount of time perfecting these drills. Below is an example of a technical training session that’s incorporated into a 6-day training week. This particular session is specific to long jump but technical emphasis is also placed on sprinting, plyometric, weight lifting, and throwing sessions.

  • General Warm Up, Static Flex, Sprint Drills: 10-15 mins
  • Hurdle Drills
    Focus: Tall posture, hip extension, control, coordination, awareness
  • 4x40m Build Ups
    Focus: Rhythm, long pushes, tall posture, bounce
  • Walking Knee Drive Switches: 4x20m
    Focus: Rapid ground strike and knee drive, posture, control
  • Alternate Skipping for Height: 4x30m
    Focus: Flat foot strikes, swinging free leg, posture, alignment, stability
  • 4 Step Long Jump Takeoffs
    Focus: Tall bouncing approach, fast takeoff strike, hip displacement, aggressive free leg drive, tall flight posture

Specific Preparation

Specific Preparation begins the Integration Phase. Here the partial skills learned during General Preparation are progressed further to more closely resemble the event’s competitive demands. Full jumping from shorter approaches becomes the glue of all technical drills and must become a program’s focus. Top speed development begins during this phase, and we gradually introduce the full approach run.

Below is an example of a technical training session incorporated into a 6-day training week during this phase. During another day of the week, we begin full approach development by establishing steps, rhythm, and check marks. Typically, this begins away from the takeoff board.

  • General Warm Up, Dynamic Flex, Sprint Drills: 10-15 mins
  • Hurdle Drills
    Focus: Tall posture, hip extension, control, coordination, awareness
  • 4x40m Build Ups
    Focus: Rhythm, long pushes, tall posture, bounce
  • Continuous Takeoffs: 4x30m at 80%
    Focus: Rapid ground strike and knee drive, posture, control
  • Short Approach Jumps: 6-12 jumps (6, 8, 10 strides)
    Focus: Full takeoff and flight, with or without landing, board accuracy, rhythm

Special Preparation, Competition

By this time, the athlete is gearing for competition and we’ve established a solid base of both physical and technical training. The athlete is now ready for competition intensity and has a strong understanding and awareness of their technical readiness. Short approach jumping remains the emphasis and the approach length becomes closer to competition distance.

Full approach sessions are also in full swing, and it isn’t uncommon to begin full approach takeoffs as well. I firmly believe that it’s very difficult to bridge the gap between increased sprinting speed and short approach technique without performing full speed jumps or, at least, takeoffs. During this phase, we only use partial skill exercises when issues arise and technical fixes are needed.

Below is an example of a technical training session that’s incorporated into a 6-day training week during this phase.

  • General Warm Up, Dynamic Flex, Sprint Drills: 10-15 mins
  • Hurdle Drills
    Focus: Tall posture, hip extension, control, coordination, awareness
  • 4x40m Build Ups
    Focus: Rhythm, long pushes, tall posture, bounce
  • Full Approach Runs: x6-8
    Focus: Check marks, rhythm, bounce, 11-1m speeds, transition
  • Short Approach Jumps: 6-8 jumps (10, 12, 14 strides)
    Focus: Full takeoff and flight, with or without landing, board accuracy, and rhythm

Organizing the Weekly Program

I’ll close with a brief discussion about training structure as it pertains to technical training. It’s important to understand the context into which the sessions fit as part of the overall training structure. I will not go into great detail here. Instead, I’ll give several examples showing how the puzzle pieces can fit together.

Example A:
Mon Tues Wed Thur Fri Sat
Accel Video Flys Video Accel Speed End
Plyo Tech Drills Approaches Tech Drills Plyo Circuits
Weights Tech Jumps Weights Tech Jumps Weights

Example B:
Mon Tues Wed Thur Fri Sat
Accel Flys Recovery Accel Speed End Recovery
Plyo Tech Drills Tempo Tech Drills Circuits Tempo
Weights Tech Jumps Circuits Tech Jumps Circuits

Example C:
Mon Tues Wed Thur Fri Sat
Video Accel Recovery Video Flys Speed End
Tech Drills Plyo Tempo Tech Drills Tech Drills Circuits
Tech Jumps Weights Circuits Tech Jumps Tech Jumps

Closing Thoughts

There’s a lot to consider when planning technical training, from exercise and drill selection to teaching strategies and ways to incorporate technical work into the weekly plan.

A successful program shouldn’t be determined by a single drill or series of progressions. More important is that we promote understanding and a self-correcting culture with our athletes. Coaches should teach drills they understand and that relate to the technical model. Always determine the purpose of an exercise and how it fits with the big picture before implementing it into the program. A drill is useless if the athlete doesn’t get it, and a coach must find a way to connect what the athlete is doing to what they think they’re doing.

Technical progressions are essential and should reflect the training of the particular phase. All training components should coincide and reflect the long-term plan. It,s important to be flexible and highly adaptive as an athlete rarely goes through a season following plan A. Coaching is a process of analyzing and adapting and requires a highly interactive approach on a daily basis.

Sometimes it’s OK to perform a drill that doesn’t make sense to anyone but the athlete. Legendary coach Randy Huntington once said, “Sometimes we do and say stupid things in order to get the job done.” Having worked with youth athletes for many years, I certainly echo these words.

As an avid learner, I spend much time reaching out to established experts on the horizontal jumps. I would like to thank several coaches for sharing their time and wisdom with me. I owe a lot of my development as an athlete and coach to them. Thank you to Randy Huntington, Mike Young, Jeremy Fischer, Dan Pfaff, Nic Peterson, Boo Schexnayder, and Carl Valle.

Please share so others may benefit.

The post The Horizontal Jumps: Technical Training for the Long Jump appeared first on Freelap USA.

Olympic Lifts: The Importance of Peak Velocity and Recommended Guidelines

$
0
0

Front Squat Bar Velocity

By Bryan Mann

For athletes doing Olympic lifts to improve sports performance, measuring peak velocity provides the best information for progressing their loads. Peak velocity also represents an athlete’s capabilities better than mean and average velocity and is not affected by injuries. These athletes don’t perform Olympic lifts to participate in weightlifting competitions; they do the lifts to improve sporting form. Their goal is to increase their speed-strength ability and explosive power.

When I began measuring bar velocity, the only metrics available were mean velocity and mean power. The software and hardware at the time were not sufficiently advanced to determine peak velocity. It’s been this way since the 1960’s when the Soviets began using velocity to analyze their lifts. It wasn’t until a few years ago that peak velocity became available.

Because I used mean velocity for a decade with great results, I was quite hesitant to change my recommendations. For each Olympic lift, I knew what the mean velocities should be. I even had it broken down by height. Why, then, would I want to change? Over the past five years, a plethora of information has become available and has greatly influenced my thoughts on what to use and why.

To begin, let’s address the confusion that seems to exist about the definitions of mean and peak velocity. Mean velocity is the average (or mean) for the velocity over an exercise’s entire concentric portion, from start to finish. Peak velocity is the fastest point during the concentric portion.

Why use one and not the other? For one, many lifts, such as squats and bench presses, have an acceleration (propulsive) and a deceleration phase. Because the two motions always occur during the concentric phase, the concentric phase is the most beneficial and stable to use for measurement. You can use mean velocity for Olympic lifts, but it might not be the best choice.

In my opinion, there are several reasons to use peak velocity for Olympic lifts:

  • The defined moment at which peak velocity occurs
  • The ballistic nature of the exercise
  • The alterations to technique that occur as a result of feedback of mean velocity
  • The inaccuracy for those with orthopedic issues
  • The difficulty for systems to determine when and what to measure for mean velocity

I’ve done most of my work with LPTs, such as GymAware. Other means of measuring velocity may lead to different reported numbers. This doesn’t mean those measurements are wrong; they’re just measured by a different means. The need may exist to look at velocity zones and profiles of individual lifts with an alternative device such as body, limb, and barbell velocity.

The Defined Moment at Which Peak Velocity Occurs

In a 2014 study done by Harbili et al.1 examining both the clean and snatch, researchers found the single moment when weightlifters hit peak velocity. This occurs at the top of the second pull. The athletes accelerated up to this point and decelerated beyond this point. Since we know when the peak occurs and now have the ability to measure peak velocity when it occurs, it only makes sense to utilize peak velocity as a metric to evaluate the lifts.

Orthopedic Issues Leading to Form Discrepancies

Over the years, I’ve noticed a common trend with athletes. They get injured, and the injuries stick around for a while. Injuries to the wrist, shoulder, and elbow are quite common among a multitude of sports, and these joint injuries can greatly impede the catching portion of the lift movements. I’ve seen several athletes with these issues who have a marvelously fast looking pull only to have a very suboptimal reading from their device because their rack was slow. Their injuries slowed down their movement during this portion of the exercise. Because the mean velocity is the mean from the beginning to the end of the movement, the slow catch decreases the velocity measurement.

These athletes often become quite frustrated, and rightly so. They’re being held back by a parameter instilled by us, and they are unable to do anything about it. While the mean velocity’s feedback is important and useful, it shouldn’t be the determining factor. By utilizing peak velocity, we eliminate the portion of the lift causing problems and impeding results. With peak velocity, athletes are better able to overload the movement and see a better transfer to their sport.

The Ballistic Nature

In a ballistic exercise, there’s an initial rapid and powerful force followed by a projection of the body, load, or implement into the air.2, 3 This is true for jump training and med ball training, but what about Olympic lifts? In a lift, peak velocity occurs at the top of the second pull. The athlete then projects the barbell into the air and attempts to drop their body under the bar to catch it in a racked position. Then they stand up for the recovery of the movement. Look back at the descriptions of the ballistic exercise and the Olympic lift. Both involve projection. When projection occurs, muscular force does not determine barbell deceleration, gravity does.

Conversely, when an athlete performs a traditional strength training movement such as a squat or bench press, muscular force determines the barbell’s deceleration. If left to gravity, the barbell will fall from the hands. Since muscular force slows down the barbell, we should measure muscular force from beginning to end because this measurement matters.4, 5, 6 To counter this, some systems use mean propulsive velocity, but this only measures the propulsive phase of the movement and disregards the decelerating phase.

I’m quite comfortable recommending mean velocity with traditional strength training because the predictive values are not much different, with R-squared and standard error estimate values being R2=.981, SEE=3.56% for MPV and R2= .979, SEE=3.77% 5 and the paucity of equipment that actually calculates MPV.

As practitioners, we should only measure and manage what we can measure and manage. We should use peak velocity for Olympic lifts because the speed of gravity will not change and the decelerating phase is irrelevant.

Alterations to Form as a Result of Mean Feedback

Athletes are kinesthetically aware and competitive. Once they understand that the objective is to obtain the highest possible number, they’ll begin to alter technique to accomplish this. For a movement done from the hang, athletes often dip below the knees to the mid-shin. More commonly, when performing a movement from the floor, they’ll try to move as fast as possible rather than doing a slow and controlled first pull into double knee bend. They’ll often shoot their hips into the air and back to get a greater ROM to produce force and achieve the highest velocity.

We know these are not acceptable movements, and they will not transfer to the playing arena. The athlete is trying to beat their opponent or teammate in barbell velocity. It’s tougher to cheat the peak velocity through momentum from an entire movement when trying to achieve a higher score. Again, I believe peak is better.

Different Heights Require Different Velocities

As previously mentioned, different ROM distances among the lifts will require different velocities. This is also true for athletes of varying heights. A few years ago, we implemented VBT at Mizzou when we had a 6’8” offensive tackle and a 5’6” running back training together. At the time, we were using mean velocity, and I believe we were going with 1.3m/s for everyone on the team. The offensive tackle struggled to stand up with loads at that velocity, yet the running back did it with ease. What gives? Well, remember that velocity equals the change in distance/time. The offensive tackle had to move a greater distance in nearly identical time, causing the discrepancy. When we delved deeper, we started to dictate velocities up by height and had the tackle lift appropriate loads. Peak velocity is no different. Gravity plays on everyone with the same acceleration. The further we go against gravity, the harder we have to push to keep going, and the faster we have to move to get there.

Determination of Mean

Another issue concerns the measurement of mean velocity. When does it end? The device doesn’t tell us because it doesn’t recognize what’s going on with the movement nor what the athlete’s intended motion is.

We see an example in the graph below. The blue line indicates the position, the red line indicates the velocity, and the blue shading indicates what was measured for the mean velocity. If you look at each of the three repetitions, you’ll see that each was measured differently. Why? Because of the way the athlete was moving. Sometimes the barbell came to a complete stop for the catch and sometimes it did not. However, peak velocity for each movement occurred at the same point. The blue line indicates the barbell’s position and the red line indicates the movement’s velocity. (We can get more information by looking to the right at the bar path. It’s a nice little feature in my opinion, but completely irrelevant to the discussion at hand.)

Power Clean GymAware Velocity

Figure 1. Velocity measurements for the power clean.

The devices used to collect velocity are only measurement devices. Think of a tape measure. It goes where we put it. It doesn’t tell us if the hook came off the end or if there’s a staple at the end of a board we’re using. It doesn’t tell us if the spot we’ve measured at a moment in time is the actual spot we want to measure. It only tells us the distance from the endpoint to here. While they have incredible software and usability, the devices only know whether or not something is moving.

When we look at the first repetition in the graph, it appears that the person caught the barbell standing all of the way up with their legs locked out, so the device read the average of the velocity during that entire pull to catch. On repetitions two and three, the barbell didn’t travel in the same manner, and the device thought that movement was completed far sooner. Although there would be very distinct velocities during reps 1, 2, and 3, they look close to the same. The lift was performed just differently enough for the system to calculate it differently.

If we refer to Nate Silver’s The Signal and the Noise: Why So Many Predictions Fail–but Some Don’t, we see that the signal clearly exists in the peak velocity but is muddied in the mean velocity.

But Wait. I Have Been Using Mean Velocity for Years!

Mean velocity has been used with the Olympic lifts since the 1960’s in the Soviet Union. R.A. Roman, in his text The Training of the Weightlifter,7 published the most effective mean velocities for improving 1RM in training. If the barbell slowed down or did not move fast enough, something was wrong with the technique. Note that the individuals only did Olympic lifts, and they were quite proficient at them. Also, they did not experience other incidences that could cause injuries that might alter form.

Roman outlined the velocities for the various lifts which I’ve listed in the table below. The information was adapted to fit the nomenclature and style of the program at the University of Missouri at the time of development.8

Table 1. Velocities for various lifts.
Exercise Velocity
Snatch from floor 1.52-1.67m/s
Snatch Power Pull 1.81m/s
Snatch Power Shrug 1.45m/s
Hang Snatch 1.96m/s
Power Clean 1.2-1.32m/s
Hang Clean 1.3-1.4m/s
Power Shrug 1.15m/s

When dealing with neurologically trained Olympic lifters, the relationship between peak velocity and mean velocity is so strong that choosing only one of the measurements would prove to be nearly irrelevant. Some athletes may have discrepancies with form that would make the best choice peak velocity. On average, however, it seems either is a useful tool. When an athlete performs a lift properly, a strong relationship exists between peak and mean velocity.

However, when Olympic lifts are done to improve performance in another sport, portions of the technique seem to be lost in translation. Most athletes do a good job with the pull but tend to lose their technique during the racking phase. This is usually related to two things: the athlete’s lack of familiarity in racking the lift and their orthopedic issues.

Important Point

When examining the Olympic lifts, we ought to realize their purpose. For most athletes, the goal is to increase their speed-strength ability and explosive power. It’s not to have perfect technique in a clean. This is akin to Olympic weightlifters playing soccer or basketball for aerobic work. They’re not going to have perfect, or in some cases even proficient, technique or form when dribbling, shooting, and passing. They’ll look like Olympic lifters trying to play soccer or basketball. Why, then, are we so concerned with perfect technique of the Olympic lifts?

Average velocity assumes that the athlete has excellent technique on the lift. If any portion of the movement slows down, the average velocity suffers. It appears that the racking position of the clean or snatch is where most athletes trip up. This portion of the lift is inconsequential to improvements in explosive strength. For force production, what matters is the point where the barbell achieves peak velocity, which is the top of the second pull (if coming from the ground).

If a highly technical portion of the lift can be impaired by an athlete’s upper extremity and thorax injuries, why are we even concerned with the average velocity? We shouldn’t be, and that’s my point. The reason for performing Olympic lifts isn’t to participate in a weightlifting competition; it’s to improve sporting form. Olympic lifters spend hours upon hours and years upon years refining their technique on the clean, jerk, and snatch. Our athletes should spend hours upon hours and years upon years refining their technique on sports skills. Olympic lifting is special physical preparedness for the lifter and general physical preparedness for the athletes involved in other sports.

In my opinion, we need to get the most bang for our buck. Peak velocity tends to better represent our athletes’ capabilities. And a previous AC separation or shoulder dislocation will not matter. If they stand up with the bar, the only thing that matters is that the peak velocity as the average has been removed due to inefficiency and ineffectiveness.

The technical nature of Olympic lifts also requires a great amount of coaching. The catch is quite technical and requires a great amount of work by the athlete and knowledge, background, and coaching from the coach. Pulls are quite simple, though, and achieve triple extension, one of the primary benefits of the Olympic lifts. I think we need to worry more on the pull and improve its technique over the catch.

In short, both average velocity and peak velocity have their place. With Olympic lifting athletes, using both provides good redundancy to keep technique in check. Otherwise, what truly matters is the velocity of the barbell at the top of the second pull, so let’s just focus on that and utilize peak velocity. It gives cleaner data.

As more data becomes available, we may make small alterations to the charts over the coming years. My aim is to perfect the system, but I’m far from that. I feel confident enough, however, to release these guidelines. What I’ve experienced matches materials from Ajan & Baroga9 as well as other coaches.

Based on my data and data from others, I have some points to make. All of the velocities listed for the clean and snatch are from the floor. From the hang, mean velocities will be a little bit faster. I have not discovered why exactly, but I’d wager it has something to do with the engagement of the stretch-reflex.

There’s also the confounding issue of individual variation. If an equation is right 80, 90, or even 99% of the time, then it doesn’t work a certain percentage of times as well. Realize that some people are outliers and may not fit these guideline velocities. For example, an athlete may appear to have great form, but they’re 5’9” and anytime they drop below 2.0m/s, they can’t catch the bar. When we see someone who clearly doesn’t meet the guidelines, we may have to adjust for that individual.

Recommended Guidelines

Table 2. Snatch from floor
Athlete Height Velocity
5′ and below 1.6m/s
5’2 1.85m/s
5’6″ 2.1m/s
5’10” 2.3m/s
6’2″ 2.5m/s
6’6″ 2.75m/s
6’10” 2.95m/s

Table 3. Clean from floor
Athlete Height Velocity
5′ and below 1.55m/s
5’6″ 1.7m/s
6’2″ 1.85m/s
6’10” 2.0m/s

Table 4. Jerk
Athlete Height Velocity
5′ and below 1.38m/s
5’6″ 1.59 m/s
6’2″ 1.8 m/s
6’10” 2.0 m/s

There are a plethora of reasons to use peak velocity for Olympic lifts, provided we have the ability to measure peak. We just need to pick the reason that makes the most sense to us. Remember that velocities depend on the type of measurement system you’re using. If you’re using an LPT, such as GymAware, these velocities should fit nicely. If you’re using TENDO, which works fantastically, ensure the setup is correct and that the tether is perpendicular to the platform during the lift.

Please share so others may benefit.

References

  1. Harbili, E and A. Alptekin. “Comparative Kinematic Analysis of the Snatch Lifts in Elite Male Adolescent Weightlifters.” Journal of Sports Science and Medicine. 13 (2014) 417-422.
  2. National Strength & Conditioning Association. Essentials of Strength Training and Conditioning. Champaign, IL: Human Kinetics, 2000.
  3. Siff, MC. Supertraining. Denver: 2000.
  4. Gonzalez-Badillo J.J., M.C. Marques, and L. Sanchez-Medina. “The Importance of Movement Velocity as a Measure to Control Resistance Training Intensity.” Journal of Human Kinetics. 29A (2011) 15-19.
  5. González-Badillo, J.J. and L. Sánchez-Medina. “Movement Velocity as a Measure of Loading Intensity in Resistance Training.” International Journal of Sports Medicine. 31 (2010) 347-352.
  6. Jandacka D, and P. Beremlijski. “Determination of Strength Exercise Intensities Based on the Load-Power-Velocity Relationship.” Journal of Human Kinetics. 11 (2011).
  7. Roman, R.A. The Training of the Weightlifter. Moscow: Sportivny Press, 1986.
  8. Mann, J.B. Power. “Bar Velocity Measuring Devices and Their Use for Autoregulation.” NSCA’s Hot Topic Series. 2011. www.nsca-lift.org.
  9. Ajan T., and Lazar Baroga. Weightlifting: Fitness for All Sports. Budapest, Hungary: International Weightlifting Federation, 1988.

The post Olympic Lifts: The Importance of Peak Velocity and Recommended Guidelines appeared first on Freelap USA.

Sports Medicine: Acupuncture’s Role in Trackside Therapy

$
0
0

ALTIS and Freelap — two of the biggest names in T&F — have come together to celebrate progress in our sport. We hope you enjoy this week’s blog-post. Share if you enjoy it!

ALTIS Acupuncturist Donna Rebadow Inserts Needles into an Athlete

By Donna Rebadow, M.S., M.Ac., L.Ac., SMAC.

Many of the ALTS athletes and a few of the coaches call Sports Medicine Acupuncture “magic” because of how quickly it works and without medications, shots, or surgery. Often, results with them are seen in one treatment.

In my view, Sports Medicine Acupuncture is about 90% science, anatomy, and physiology, and 10% magic. It is both an art and science.

Many folks are curious about and misunderstand acupuncture. The most common question that I’m asked is: “Does it really work?” Yes. Acupuncture really works. The question that I’m most interested in, however, is “What is Sports Medicine Acupuncture’s role in both trackside and performance therapy?”

Acupuncture is the insertion of fine stainless steel needles into the body for the purpose of pain relief and to treat a multitude of physical conditions. It’s a system that came to us from China about 2,000 years ago. It has been practiced in China for over 4,000 years, but the written record and system is what gives us the 2,000-year mark. Regardless of the confusion about the start date, we know that it’s been around a long time.

There are many studies that report the cellular mechanisms of acupuncture1, and some that address the biological effects of acupuncture treatment2. I refer you to the two studies at the end of this blog if you’re interested in the biology of acupuncture.

The efficacy of acupuncture was never more evident to me when I traveled and studied at the Chengdu Hospital of Traditional Chinese Medicine (TCM)3. I was there for six weeks, from May to June in 2008. The Great Sichuan Earthquake (8.0 Ms) had hit on May 12th, and I arrived with two of my colleagues on May 22nd. We were still feeling the aftershocks when we arrived and for about 2 – 3 weeks later. At the time, many people were fleeing both the university and the city, but the three of us were crazy about coming to learn, and mostly to help. That quake killed 69,197 people and left 18,222 missing. The staff there said we were heroes for staying, but they and the people of Chengdu are the real heroes. The experience was humbling.

Our hospital and the “Western” hospital down the street were treating many of the injured. The hospital assigned me to the Internal Medicine ward, and I saw amazing things. The I.V. bags were are filled with Chinese Herbal medicines, and we treated many of the crushing injuries with acupuncture. The pain relief was immediate and allowed many of the patients to be transported down the street for additional orthopedic treatment (casts, splints, etc.). From this experience, I knew that when I got back to the States, I wanted to further my studies with Sports Medicine Acupuncture.

When I returned, I made lots of inquiries into the best Sports Medicine Acupuncture program, and many directed me to Matt Callison’s program out of San Diego4. So I studied there and received my Sports Medicine Acupuncture Certification.

So, back to the main question that I asked – What is Sports Medicine Acupuncture’s role in both trackside and performance therapy?

“Sports Medicine Acupuncture incorporates principles from Traditional Chinese Medicine (TCM) and Western Sports Medicine to view the patient’s injury from a truly integrated perspective.”5 It is based on the following concept. “There is a segmental relationship with the spinal cord, the organs (zang fu), and the myofascial tissues that can support health or be adversely affected by their inherent neural and channel interrelationship.” We use “specialized Huatuojiaji needling techniques, acupuncture, and motor point prescriptions to release vertebral fixations and break the perpetuating cycle of facilitated segments that cause recurring injury.”6

The Sports Medicine Acupuncture Certification education has given me the skills necessary to assess and treat acute trackside conditions quickly and efficiently. The ALTIS performance triad of coach, athlete, and therapist is a perfect home for this modality. I would add that having Jerod Carnahan, Emily Robinson, Rick Wade, Junko Yazawa, and their skills in both Active Release techniques and Neuromuscular Facilitation speed up the process for correcting many presenting conditions. This is the role of Sports Medicine Acupuncture in trackside therapy.

In addition to the trackside work I do, Performance Therapy allows me an hour of clinic time to use all of the aspects that I have available as a Sports Medicine Acupuncturist. I conduct further postural evaluations, manual muscle, and orthopedic testing and needling using both Traditional Chinese Medicine points and the Huatuojiaji needling techniques.

The “art” or “magic” part of the acupuncture is all of the experiences that I bring, both past and present, having been or currently: an amateur then professional athlete, college professor, TCM acupuncturist, martial artist (Judo, Tai Chi, Qi Gong and Kung Fu), sports medicine acupuncturist, and non-traditional energy healing practitioner.

Dan Pfaff, the Education Director of ALTIS, saw this and asked me to come on board May of 2014. I’m now retired from two careers and having my third career with ALTIS. I still maintain my Spring Training Sports Medicine Acupuncture duties with eight Major League Baseball Teams, but ALTIS has my heart and soul!

Thank you, Dan and Matt.

Please share so others may benefit.

References

  1. Cellular Mechanisms in Acupuncture Points and Affected Sites. Wolfgang Schwarz and Quanbao Gu.
  2. Deciphering the biological effects of acupuncture treatment modulating multiple metabolism pathways. Aihua Zhang, Guangli Yan, Hui Sun, Weiping Cheng, Xiangcai Meng, Li Liu, Ning Xie & Xijun Wang Scientific Reports 6, Article number: 19942 (2016)
  3. Chengdu Hospital of Traditional Chinese Medicine.
  4. Sports Medicine Acupuncture Certification Program
  5. What is Sports Medicine Acupuncture?
  6. SMAC (Sports Medicine Acupuncture Certification) Module I.

The post Sports Medicine: Acupuncture’s Role in Trackside Therapy appeared first on Freelap USA.

Usain Bolt vs. NFL Running Back Chris Johnson in a 40yd Dash

$
0
0

2015 NFL Timing Gates

By James Smith, Global Sport Concepts and Athletic Consulting

In 2012, NFL star running back Chris Johnson challenged multi-World and Olympic Champion Sprinter Usain Bolt to race in a 40yd dash; that ultimately never happened. This article explores a theoretical matchup.

Note that data will be pulled from each athlete’s fastest recorded times (Bolt’s 100m WR in 2009 and Johnson’s NFL Combine in 2008).

A Kinematic Discussion of Sprinting as Rectilinear Motion

It must be noted that while electronic timers are staged at the combine, the times you see posted during coverage of the combine are hand times. In 2010, NFL Scout Mark Gorscak (who manages the start of the 40yd dash at Indianapolis) told me that the electronic timers are only set up as a means of checks and balances. Additionally, and consistent with what Mark told me, in 2009 I was made privy to the actual NFL data sheets for the combine and what was made evident is the arbitrary means of arriving at “official times” for players in the 40yd dash. Each player runs the 40 two times. On the data sheet, there were two columns for the hand times and two columns for the electronic times. Surprisingly, however, the time listed for the “official time” was neither a product of calculation nor was whatever method used to arrive at it consistent for each player. For example, one player may have had:

  • Hand Time 1: 4.50sec
  • Hand Time 2: 4.52sec
  • Electronic Time 1: 4.63sec
  • Electronic Time 2: 4.65sec

Yet the ‘official’ time was 4.58sec

Whereas, another player with identical times would have an ‘official time’ of 4.52sec.

Regardless, however, the entire business of ‘official times’ is predominantly something for the fans to talk about because all team personnel at the combine from coaches, to managers, to scouts have their stopwatches in their hands. Whatever the number says on their stopwatch is what they record on their own data sheets. Thus, at the end of the day, the stopwatch continues to provide a reference for speed in the NFL.

The following article is an excerpt from my upcoming book on the Governing Dynamics of Coaching. The information discussed here was taken from the section on Biodynamics and pertains to the kinematic domain of displacement- specifically rectilinear motion by way of the translatory realm.

Displacement is a vector quantity and is characterized by magnitude and direction (different from the scalar quantity of distance which only concerns magnitude). Displacement regards the change in position regarding initial and final states.

The SI (Système International d’unités), or international system of units, is the metric system. As a consequence, the international unit of displacement is the meter.

Translational Motion

The motion of all components of a body (particles) that move through an equal distance in equal time is defined as translatory motion. There are two kinds of translatory motion:

  • Rectilinear
  • Curvilinear

Consider the profile view of a sprinter and their path of travel during a flying sprint between cones. This is rectilinear motion in which the lines connecting the sprinter’s position crossing the first cone (initial state) and the sprinter’s body as it crosses the second cone (final state) are parallel.

Consider the profile view of a 100m sprinter and their path of travel from the start to the finish. This is rectilinear motion in which the lines connecting the sprinter’s position in the blocks (initial state) and the sprinter’s body as it crosses the finish (final state) are parallel

When calculating the average velocity of rectilinear displacement one may use the following equation:

v = ∆x ÷ ∆t

where ∆ (delta) is change, x is displacement, and t is time

For example: when Usain Bolt set his WR 9.58 in the 100m in 2009 in Berlin, his fastest 10m split (.81) was between the 60m and 70m mark. His 60m split was 6.29, and his 70m split was 7.10 (2), therefore:

v = (x2 – x1) ÷ (t2 – t1)
v = (70m – 60m) ÷ (7.10sec – 6.29sec)
v = 10m ÷ 0.81sec
v = 12.35m/s

And when calculating for acceleration:

a = Δv ÷ ∆t

Staying with the Bolt 9.58 example, we know that his average velocity at 60m was 12.20m/s and, as shown above, 12.35m/s at 70m (2), Therefore:

a = (v2 – v1) ÷ (t(sub>2 – t1)
a = (12.35m/s – 12.20m/s) ÷ (7.10sec – 6.29sec)
a = (0.15m/s ÷ 0.81sec)
a = 0.19m/s2

This extremely small value for acceleration may seem odd to readers who are not familiar with the stages of acceleration just before attaining maximum velocity. In this case, acceleration is nearing 0 due to the sprinter drawing imminently close to attaining maximal velocity (in which acceleration ceases to occur).

Alternatively, if we take time 0 at the start and calculate that along with Bolts time, minus reaction time of 0.146, (1.74sec) and velocity at the 10m mark (5.29m/s),[2] we have:

a = (5.29m/s – 0m/s) ÷ (1.74sec – 0sec)
a = 5.29m/s ÷ 1.74sec
a = 3.04m/s2

As acceleration defines the rate of change of velocity, we know that it is one of the most fundamentally important locomotive qualities for nearly all team sport athletes. Curiously, however, the language of acceleration in SI units is relatively foreign to coaches, athletes, media, and the viewing audience. Further, one may observe the magnitude of subject matter incompetence that exists amongst coaches and media who suggest that athletes attain their top speed in very short distances. In American football, for example, one may routinely note the instances in which coaches or media describe how a running back hits the hole at top speed.

NFL Running Back Chris Johnson recorded some of the fastest sprint times in the history of the NFL combine with a 1.40sec split for the 10yd and a 4.24sec split for the 40yd[5]. Keep in mind, however, that NFL combine timing is done by hand (despite the presence of electronic timing equipment) and the accepted margin of error, regarding short sprints, is 0.24sec when hand timing. Thus, a plausible fully automatic time conversion (not including a reaction time) for Johnson’s 4.24 is 4.48. Never the less, the metric conversion for 10yd and 40yd is 9.144m and 36.576m respectively.

From this, we may calculate Johnson’s velocity and acceleration at the 10yd and 40yd marks and provide education to any coach or media person who has mistakenly operated under the false knowledge that a running back, or any other athlete, is hitting their maximal velocity in a distance as short as 7yds, or 6.4m, (the distance the running back lines up at relative to the line of scrimmage).

Johnson’s 10yd kinematic quantities of average velocity and acceleration:

v = ∆x ÷ ∆t
v = (9.144m -0m) ÷ (1.40sec – 0sec)
v = 6.53m/s
a = Δv ÷ ∆t
a = (6.53m/s – 0m/s) ÷ (1.40sec – 0sec)
a = 4.66m/s2 (remander of the hand timing and 10yd mark)

Johnsons 40yd kinematic quantity of average velocity between 40yd and 10yd. It must be pointed out, however, that there is no available data of Johnson’s 30yd split. For this reason, the calculable data set of 10yd and 40yd is quite broad and thus renders the conservative value listed below:

v = (36.576m – 9.144m) ÷ (4.24sec – 1.40 sec)
v = 9.66m/s

From this, and despite the error associated with hand timing, one may definitively state that 9.66m/s is a greater value for average velocity than 6.53m/s (at the 10yd mark). Thus, one of the fastest running backs (and players in general) to have ever played in the NFL is incapable of achieving his maximum velocity in a distance of 10yd or less. (again, note that the value for average velocity would be greater and more accurate if we had a 30yd split for Johnson; thereby showing a more accurate picture of average velocity over a smaller displacement).

Those interested in Bolt’s hand timed acceleration over 10yd may and convert the 1.74 time for 10m to hand time (-.24) we get a corrected time of 1.50.

a = (5.29m/s – 0m/s) ÷ (1.50sec – 0sec)
a = 5.29m/s ÷ 1.50sec
a = 3.53m/s2

From here we can use the kinematic equation (4) to solve for Bolt’s time to 9.144m in which we will subtract 9.144 from 10 to arrive at a displacement of -0.856m:

(where d= displacement, vi = initial velocity, a= acceleration, and t = time)

-0.856 = 5.29t + 1/2 • 3.53 • t2

Using the invaluable online resource Wolfram Alpha, we are given two solutions for t:

-2.82552
-0.171645

Taking the solution closest to 0 we subtract 0.17 from 1.50 to arrive at Bolt’s 10yd time, converted for hand time, of 1.33sec.

While we’re at it, we may estimate Bolt’s average velocity at the 40yd mark in his 9.58 world record. We know that his average velocity at 30m was 11.11m/s and at 40m it was 11.63m/s, and his time at 30m was 3.78sec and 4.64sec at 40m.[2]

From this we may calculate his acceleration between 30 and 40m:

a = (11.63m/s – 11.11m/s) ÷ (4.64sec – 3.78sec)
a = 0.60m/s2

If we take an acceleration of 0.60m/s2 (while not 100% uniform, for this example approximation we’ll allow for it to be in order to use kinematic equations), and we know that his 30m split was 3.78 at an average velocity of 11.11m/s, and the 40yd mark (36.576m) is displaced by 6.576m from 30m, we can select the most appropriate equation from the kinematic equations[4] that most well suits the available data. Of the data we have, what we must find is time (t) for Bolt to sprint from the 30m mark to the 36.576m mark then we may add that time to his 30m split.

The appropriate equation is the same one listed earlier. When we plug in our known, and relevant, data we arrive at:

6.576 = 11.11t + 1/2 • 0.6t2

From here we may use Wolfram Alpha again. To arrive at two solutions for t:

-37.6161
0.58273

By taking the positive solution (0.58273) and adding it to Bolt’s time at 30m (3.78), we arrive at a sum of 4.33273 rounded to 4.33.

Further, we must subtract Bolt’s reaction time (to the starting gun) in that particular race (0.146) which brings the electronic time down to 4.18.

Lastly, we subtract our known correction for hand timing (.24) and Bolt’s fully electronic conversion to hand timing is 3.94 compared to Chris Johnson’s hand-timed 4.24.

Running Surface and Starting Blocks

To be fair, the remaining variables to be discussed are the surfaces on which each athlete is sprinting in addition to the fact that the T&F sprinter is using starting blocks and subject to environmental conditions.

While the running surface at Lukas Oil Stadium (the site of the NFL combine) is relatively fast artificial field turf, it in no way provides the level of stiffness such as the modern T&F Regupol Compact surface (5) that is featured at the Olympiastadion in Berlin.

The field in Lukas Oil Stadium is not subject to the elements, however. Thus, wind and temperature have no bearing on the sprint performances at Indianapolis. Alternatively, in that moment in 2009 in Berlin, Bolt had a very modest tailwind of 0.9m/s[2]. Engineering efforts have determined that a tailwind between 0ms and 1m/s results in a -0.05sec advantage at sea level for up to 100m.[1] Therefore, we may add 0.05 to Bolt’s electronic 4.18 to arrive at 4.23 and from here we subtract the hand time correction of 0.24 to arrive at 3.99. Likewise, if we add 0.05 to the calculated 10yd hand time of 1.33, we arrive at 1.38.

For these reasons, we understand that Johnson’s hand-time 40yd dash would be faster on the Regupol Compact surface (even without starting blocks and provided he wasn’t facing a considerable headwind) and Bolt’s converted fully electronic time would be slower on the Lukas Oil field surface.

One final example, without estimating what each athlete’s time differentials would be on either surface, when comparing 3.99 to 4.24 we may calculate the distance separating Bolt and Johnson at the finish line. In using the following kinematic equation.[4]

We may compute Bolt’s velocity at the finish line (again, allowing for acceleration to be uniform in order to use these kinematic equations even though acceleration is not uniform when sprinting).

vf = 11.11m/s + 0.6m/s/s • 0.58273sec

Our solution is 11.46m/s

We know that:

v = ∆x ÷ ∆t

Thus,

∆x = ∆t • v

Therefore,

∆x = 3.99 – 4.24 • 11.46
∆x = -2.865m

According to these calculations, and acknowledging that the time differential would not be as substantial if both athletes were racing on the same surface, Bolt would beat Johnson in a 40yd dash by 2.87m or 9.42 feet. Given a margin this substantial, Bolt would be afforded a significant leeway in reacting slower than Johnson at the start.

In closing, if there was any question in anyone’s mind regarding the outcome of a 40yd race between these two athletes (in their prime), despite the variability in running surfaces and environmental conditions, one may state with confidence that if Usain Bolt and Chris Johnson were to race 40yds 100 times, that Johnson, despite being much more competitive over 10yd, would lose every race. Further, the only athlete who would be hitting their max V in a distance less than 10m would have the power to weight ratio of three-year-old child.

Please share so others may benefit.

References

  1. Sprinting in the Wind
  2. Helmar Hommel Analysis 100m Men Final Bolt
  3. Sprinters’ paradise: 8 best tracks for fast times
  4. The Kinematic Equations
  5. NFL Combine Records

The post Usain Bolt vs. NFL Running Back Chris Johnson in a 40yd Dash appeared first on Freelap USA.

Another Coach’s Relay Epiphany

$
0
0

Athlete holding relay baton

By Ken Jakalski

First, thanks to Coach Roger White for his enlightening article on 4 X 100 relay exchange. His analysis and perspective have inspired me to share a few insights, as well as a few overarching philosophies that—going back over forty years—pretty much led me to the same conclusions he has reached.

Applying Three Overarching Philosophies in Coaching the 4 X 100

Just a few meets back I had the opportunity to talk to a sprinter I coached at another school 31 years ago. While he was watching his son competing in the sprint events, he commented on how disappointed he was with the way his son’s team was approaching exchanges in the 4 X 100. He alluded to a math calculation I used that resulted in a no verbal command/ hand back at a specific point in the zone method of exchange that was effective in helping his teams earn state medals.

At that point, I called over my current relay guys and asked him to share with them what he just mentioned, because the method of take-off-mark determination we were using was essentially the same one I applied ever three decades ago.

This was the same formula Coach White discussed in his recent article.

I very much liked Roger’s reference to Tom Ecker’s classic work, Basic Track and Field Biomechanics. My introduction to Ecker’s approach to relay racing came from an earlier publication of his, Track and Field Technique Through Dynamics published by TafNews Press in 1976. That book brought to my attention Ecker’s original premise—that “placement of runners and baton passing skill can have a profound effect (for better or worse) on the total time for any sprint relay.”

Tom Ecker's Technique Through Dynamics

Figure 1. 1976 printing of Tom Ecker’s Technique Through Dynamics.

What Ecker was suggesting made sense to me. The baton needs to travel as fast as possible at the time of the exchange, and that the exchange should be made deep in the zone at a point closer to what the outgoing runner’s top speed will be. How to determine that was the problem Ecker was able to solve.

In both editions, he offers that, “by using a simple formula, the coach can determine the exact go-mark distance for any two relay runners with very little time and effort.” In the fourth and earlier editions of Biomechanics, he simply changes the numbers in his formula from yards and feet to meters.

Like Coach White, I came across the table version of Ecker’s formula in Gerhardt Schmolinsky’s Track and Field: Text Book for Coaches and Sports Teachers published in 1978. The chart presented in the book is described as an “aid to assessing with a fair degree of accuracy the spot for placing the starting marks after clocking the time of the runner with the baton on the last 25 meters and of the receiving runner on the first 26 meters.”

Both works were as helpful to me as they were to Coach White, and it feels good to know that my epiphany moments about relay exchange were similar to those of a great coach like Roger. My only modest contribution is in presenting my three overarching philosophies for this event.

One

Just as no two relay exchange zones are exactly the same in terms of running distance with and without the baton and gravitational forces relative to curves, no two runners are exactly the same in terms of acceleration ability, speed regression over longer distances, coordination, and reactivity. Ecker’s Biomechanics provides the following pieces of advice. “A poor starter should not run the leadoff leg. Poor curve runners should not run the first or third legs. Poor baton “givers” should not run the first, second, or third legs. Poor baton “receivers” should not run the second, third, or anchor leg.

He acknowledges that these points are obvious, and I think this is where a coach’s personal overarching philosophy on the 4 x 100 relay comes into play. For example, I understand that most of the excellent research on this relay will point to the importance of the fastest athlete running first because he runs farther with the baton than the anchor runner, but the reason we are using the formula in the first place is to maximize the outgoing runner’s speed so that the baton is not slowing down in the zone. Therefore, the amount of running the sprinter does to build up speed before getting the baton is important.

I always consider the difference in each of the four zones, as well as the nuances in ability of the four fastest sprinters I believe should be in this event. My shortest sprinter with a low center of mass and good acceleration I like to run first. My fastest sprinters, because of the amount of running they are doing both with and before getting the baton I like to put in either leg two or three. The fastest of those two I will put in the third leg, generally because I believe he is the most prepared to deal with negotiating the curve. As Jesse Tukuafu noted his research on curve running, “In order to be continuously changing direction around the curve, a runner must generate centripetal forces with the ground. This requires athletes to put some of their efforts into generating ground reaction forces that accelerate them towards the axis of rotation of the curve. As the medio-lateral (ML) ground reaction forces increase to generate centripetal forces, the vertical forces are decreased which results in a loss of running speed.” My fastest sprinter is most likely the one whose speed through the curve decreases the least. He is a sprinter who probably runs many 200’s and 400’s, and is the most experienced at making adjustments to run the curve effectively.

Two

To understand the zone, the athlete must live and work in the zone. Simulation training (relay baton practice) that does not account for the true context of high-speed exchanges in each of the three zones does not prepare athletes for live race conditions.

This is where the original notion of a chart or projection table was a major step forward in helping coaches gets a better handle on how to coach their 4 x 100 teams. Its benefit is that, provided the input data is good, there is a logical starting point that does not require multiple practices.

And Ecker points out the problem with conventional type relay practices. “The typical short run –up practices coaches employ results in the incoming runner accelerating rather than decelerating as is the case over the actual distance of each leg in the relay.” I like to gather data by having each sprinter run the actual distance needed to be negotiated in his leg to get a more accurate assessment of his slow down over those final 25 meters. This means the testing is conducted through the actual zone on the track.

One of the surprising insights in Ecker’s Biomechanics is his focus on accuracy. “When using these formulas,” he says, “be aware that errors in timing will produce errors in distances. Therefore, it is essential that the timing be as accurate as possible.” Years back I would station an athlete at the fly-off mark and catch the drop of his hand to get a 25-meter incoming time. Now I use Freelap.

Three

Declines in force application during repeated practice trials make the value or such rehearsals questionable. This is the one key insight I picked up from Biomechanics.
“The commonly used trial and error method can take hours of practice time and often produces go-marks that are not accurate. Because of fatigue on the part of the relay team members, the go-mark distances that seem correct at the end of one trial-and-error session often turn out to be all wrong at the next session.” That has always been my observation and another of the benefits of trusting a method that may only need tweaking after races themselves.

But there is another rendition of the sprint table that coaches might wish to consider. Randy Huntington sent a detailed Excel chart to Christopher, who then forwarded it to me. I asked Randy if it was OK to present this in a follow-up to Roger’s article, and he graciously gave me permission to discuss the spreadsheet.

I will briefly digress to present my relationship with Randy, and my appreciation for what he has done throughout his career for those of us involved in the sport of track and field. Randy has always been patient, generous, and supportive in dealing with coaching colleagues and as well as athletes, and that at times can be difficult, especially when differing approaches become contentious. Several years ago while I was debating Dr. Mike Yessis on the significance of the pawback technique for high speed sprinting, I sent Randy images run through SiliconCoach of more advanced high school athletes who, though trained by their coaches to execute an effective pawback, revealed no such pawing action in the speed trials I conducted.

Sprinter Pawback and Speed

Figure 2. SiliconCoach image referenced in pawback discussion.

Randy’s response was that the pawback was not in evidence because the sprinters were spending too much time in backside mechanics. I should have accepted that as a credible answer, but at the time I was hesitant because in my own mind I could not understand how Weyand’s analysis from JAP2000—that swing time in all sprinters at their respective top speed was essentially the same—could jive with Ralph Mann’s position, going back to the early eighties, on the significance of frontside mechanics. How could swing times be the same if it appeared as if a significant part of that swing was being eliminated?

When Drs. Weyand and Mann did clinic sessions together and agreed with each other’s research, I was compelled to think a little deeper, and realized that, rather than something being “cut out” of the swing, the entire swing was just shifted forward, thereby allowing a more productive thigh angle on the frontside (70 degrees in the elites tested).

Now that Dr. Ken Clark’s groundbreaking springs study, conducted with Dr. Weyand at the SMU locomotion lab, has revealed that elite sprinters have a surprisingly fast rising edge to their force curve, and are applying greater forces in the first half of contact, the mechanics of exactly how they accomplish this are becoming clearer. They are applying a powerful leg drive with a stiff contact on landing.

The training implications of these findings point to minimizing backside swing, a maximizing of frontside knee lift, a forceful down and back ground attack, and a shin vertical/stiff contact on the ball of the foot. And the coaching cues to achieve this kind of landing, things like Frans Bosch’s “whip from the hip” and some of Dr. Clark’s cues such as “hammer the nail and “spin the globe” do indeed seem somewhat like what the original notion of a pawback was intended to achieve.

So Randy, if you’re reading this, thanks for your patience in allowing me the time to better wrap my head around a mechanic that may still be semantically problematic—the pawback—but conceptually similar to what current research is suggesting, and what you pointed out years ago.

And now back to Randy’s approach to the 4 x 100

The table that appears is apparently based on a concept Fred Wilt, the famous “FBI distance guy,” developed many years ago. Like all Excel spreadsheets, this one has probably gone through several versions, but the math is still accurate. For example, on the table that appears in the GDR textbook, if an incoming runner’s last 25 meters is 2.8 seconds, and the outgoing runner’s first 26 meters is 4.1, the take-off mark for the outgoing sprinter is at 11.6 meters on the GDR chart and 11.61 on Randy’s spreadsheet. Assuming both are projecting a free distance of 1 meter in the baton exchange, coaches should have no concerns using Randy’s work.

What I like that he’s done is to add things in a simple way that gives coaches some flexibility. For example, assuming that coaches may want to run a full relay simulation in practice, he accounts for the fact that marks will be different in trials than they would be in an actual competition due to a runner’s aggressiveness. As a result, he presents both practice mark projections as well as what coaches can anticipate as take-off marks for an actual race.

I will close with one final overarching philosophy on the 4 X 100 relay. I refer to this event as Full Tilt Boogie—acting in an extremely focused manner in the pursuit of a goal and putting forth a superlative level of endeavor that is inherently exciting. If a formula gives my sprinters the confidence to run with abandon, trusting that the incoming runner will deliver the baton to them late in the zone when their arm comes back, it is well worth using. High risk is not an issue for me.

I like what Coach Vince Anderson once said about coaching concerns over possible failures in the 4 X 1: “Can someone explain what, exactly, is a safe pass?”

Please share so others may benefit.


References

  1. Clark, K. P., and P. G. Weyand. “Are Running Speeds Maximized with Simple-spring Stance Mechanics?” Journal of Applied Physiology 117.6 (2014): 604-15. Print.
  2. Clark, K. P., and P. G. Weyand. “Are Running Speeds Maximized with Simple-spring Stance Mechanics?” Journal of Applied Physiology 117.6 (2014): 604-15. Print.
  3. Tukuafu, Jesse Tipasa, “The Effects of Indoor Track Curve Radius on Sprint Speed and Ground Reaction Forces” (2010). All Theses and Dissertations. Paper 2348.
  4. Weyand, P., Sternlight, D., Bellizzi, M. and S. Wright. “Faster top running speeds are achieved with greater ground forces not more rapid leg movements.” Journal of Applied Physiology, 89: 1991-2000, (2000).Print.

The post Another Coach’s Relay Epiphany appeared first on Freelap USA.


Track & Football Consortium III

$
0
0

Track and Football Consortium

By Tony Holler

Montini High School, Lombard, IL June 17-18, 2016

Explosive power and speed are fundamental to football and track. Chris Korfist and I have led a campaign to merge the two sports into a year-round training program where both sports benefit. More important, merged programs fight the cancer of specialization prevalent in today’s schools.

Selfish football coaches actively promote specialization or quietly condone the concept of the one-sport athlete.

Distance coaches who lack the speed-power mindset are often head track coaches. Their volume-based run-run-run mentality fails to attract football players. The football players who do come out for the team get discouraged and defect to their safe zone, the weight room.

Too many football coaches treat their players like indentured servants. To the tyrannical football coach, the more control, the better.

Too many track coaches complain about the football staff while their program consists of distance runners and non-athletes.

Many football coaches fail to understand the incredible value of track & field.

Many track coaches fail to offer a training program that attracts running backs and wide receivers.

In Illinois, only 43% of scholarship football players run track. In Texas, 74% of scholarship football players run track. Since Illinois produces about 20% the number of football scholarships as Texas, maybe Illinois should reconsider specialization.

Bringing football and track together takes more than talk, compromise, and rational thinking.

Football has lots to learn. Training is so much more than hard work and creating mental toughness. I walk away from any coach who brags about torturous workouts.

On the other hand, track must learn to train football players as explosive sprinters. High-volume fitness sessions are not sprint workouts. Sprint programs must be based on sprinting.

Our first consortium attracted nearly 75 people. Consortium II attracted 200 people from 13 states. Some were track coaches, some were football coaches, and many coached both. We even had distance coaches, personal trainers, and chiropractors attend.

Several of our sessions will teach sports activation. “Be-Activated” is a manual therapy system developed and taught by South Africa’s Douglas Heel. We aren’t selling activation; we are teaching it. What if you could improve the performance of your athletes? What if you could prevent injury? What if you could take your athletes from fight, flight, or freeze to the parasympathetic state? If this sounds interesting, Consortium III is the place to be.

Keynote Speaker Consortium III

Oregon University Football Coach Jimmy Radcliffe

Oregon University Football Coach Jimmy Radcliffe.

When looking for the perfect keynote speaker, I wanted a guy who was all about speed and power. I wanted to find someone who trained football players like sprinters and sprinters like football players. I wanted to find someone on the cutting edge of plyometric and agility training working at a progressive new-age program, somewhere like Oregon. How about Jimmy Radcliffe?

Jimmy Radcliffe is the best.

Jimmy Radcliffe will speak on “Bullets Over Bowling Balls” and “Efficient In-Season Speed and Strength Training to Optimize Performance and Prevent Injuries”.

Chris Korfist

Chris Korfist is the best sprint coach I know. Sometimes I wonder if Chris Korfist sleeps. The speed training of Chris Korfist is not the same as it was last week. It’s always evolving. I’ve never heard Chris give the same presentation twice.

Chris was the first American coach living in the U.S. to buy the 1080 Sprint. Exxentric’s kBox is now fundamental to his strength training. Chris was the first coach I knew who used automated timing of the fly-10 as a base for speed training.

Montini Football Player

Chris Korfist has helped Mitch West become a potential state champion in the 100m dash. It’s no surprise Mitch West was the fastest player on Montini’s state championship football team.

Chris Korfist won two state championships while coaching at York High School. He developed a sprint culture at a distance school.

Chris Korfist introduced me to Douglas Heel of Cape Town. Korfist is the Douglas Heel of the U.S.

Chris Korfist will give four presentations:

  • Weight Training For Speed
  • Agility
  • Video Sprint Analysis
  • Sports Activation

Tony Holler

I coached sprinters all wrong until 1999. At a clinic in St. Louis I attended a presentation by Paul Souza of Wheaton College (MA). Souza owned the room and fundamentally changed my entire coaching philosophy. I transformed from old school to new school. I’ve never looked back.

The philosophy of training smarter, not harder, evolved into a religion for me. Every year I find science that supports my training methods. I ignore aerobic conditioning and my sprinters never jog. My sprint program is more than 90% alactic (max intensity, less than 10 seconds, and quality rest). We seldom visit the “Lactate War Zone”. We never train for aerobic endurance.

At the time of writing this article, my team has competed in 11 track meets, and we’ve done only seven lactate workouts in the past ten months. My 4×2 team was #1 in Illinois for the indoor season. My 4×1 presently ranks #2 in Illinois. I expect Plainfield North’s 4×1, 4×2, and 4×4 to qualify for the state meet. Our hopes are high.

Plainfield North Relay Team

This 4×2 team went undefeated indoors and ended up Illinois #1.

My teams are always fast, and my sprinters love track and field.

28 of my 52 sprinters are football players.

In addition, my freshmen football teams have not lost a game since 2011.

I will give four presentations:

  • What Does a Sprint Practice Look Like?
  • Train Smarter, Not Harder (Energy Systems)
  • Feed the Cats
  • Implementing Activation

Joel Smith

Sprinting improves jumping, and jumping improves sprinting.

Joel Smith is a perfect fit for our consortium. I met Joel Smith at a Douglas Heel “Be-Activated” Seminar. Smith is an assistant strength and conditioning coach at the University of California where he works with track and field, swimming, and tennis. He is the founder of Just Fly Sports and the author of Vertical Foundations, the first book to take a holistic, biomechanical approach to jump training.

Joel Smith will deliver presentations on plyometrics and jump training.

Joel Smith Vertical Ignition

Joel Smith published Vertical Ignition in 2015.

Dan Fichter

Like Joel Smith, Dan Fichter returns for his third consortium. A long-time partner of Chris Korfist, Fichter is presently the head football coach at Irondequoit High School in New York and the owner of Wannagetfast Power Speed Training in New York and Tampa.

Coach Dan Fichter

Coach Dan Fichter

Dan Fichter sums up his training as “a combination of Eastern European methodology and new-aged research from biomechanists from around the globe.”
“We do not train in a sport-specific, core-dominated, or general fad mantra. We utilize proven research on speed and strength training that has produced world-class results.”
Dan Fichter will speak on two topics:

  • Football: The Practice Plan
  • Training the Nervous System

Matt Gifford

I first learned of Matt through some of his very insightful postings on Twitter. Matt is a track guy, Level 1 USATF Certified, and an ALTIS apprentice.

Matt Gifford is also a football guy. Working at NX Level in Waukesha, WI, Matt is the Director of Speed Development for NFL Pro Day Training.

NX Level in Waukesha, WI

NX Level in Waukesha, WI

Matt will speak on two topics:

  • Acceleration Development
  • Speed & Strength Progression for Football

Check out some of Matt’s work on Freelap USA and his website CoachGiff.

Lou Sponsel

Lou Sponsel is the head football coach at Palatine Fremd high school and was the subject of my first Freelap article, Sprint-Based Football.

Lou Sponsel is a progressive out-of-the-box guy. Lou will present on “Triphasic Training” which he learned from Cal Dietz of the University of Minnesota.

Check out the book written by Chris Korfist and Cal Dietz, Triphasic Training.

Triphasic Training

Alec Holler

My son, Alec, is 29 years old and is already considered one of the best hurdle coaches in the state of Illinois.

Edwardsville Hurdlers

Travis Anderson of Edwardsville was last year’s Illinois silver medalist in his sophomore season. I took this picture last weekend.
How many high school hurdle coaches have produced these marks in the past two seasons?

  • Craig James 14.07 & 38.10 (2014, senior season)
  • Isaiah Michl 14.54 & 37.13 (2015, senior season)
  • Travis Anderson 13.98 & 39.20 (2015, sophomore season)

Alec Holler’s varsity football assignment is the defensive backfield. Interception records have been set in both the last two seasons. Edwardsville’s quarterbacks have thrown only ten interceptions while Alec’s defensive backs have picked off 32. In all but one game last year, Edwardsville held their opponents to less than 100 yards passing.

Catherine Garceau

Catherine Garceau, Olympic Bronze medalist, believes that optimal performance is achieved through physical, mental, emotional, and spiritual well-being. Catherine’s book, Swimming Out of Water, Garceau shares her Olympic story.

Catherine Garceau Swimming Out of Water

Catherine Garceu brings intuition, experiential learnings and a hybrid of best practices to coaches and athletes. Trained in Emotional Freedom Techniques (Tapping), Qigong, Be Activated, Resistance Stretching, and Regression Resolution, her combined passion and skills create rapid shifts in mindset, lifestyle, and performance.

Activation Specialists

Dr. Nate Porcher and Dr. Kerry Egan will be presenting on topics relating to activation. Stephanie Considine and Kipling Solid will also return as presenters.

Where, When, How Much?

June 17-18

Check-in: Noon, Friday, June 17th

Conclusion: 5:00, Saturday, June 18th

Place: Montini High School, Lombard, IL (about 20 miles from both O’Hare and Midway)

Hotels: I plan to stay at the Hyatt Place Lombard, but there are dozens of hotels in the area.

Schedule: Schedule of Presentations

Cost: $150

Link to sign up: Track-Football Activation Consortium III

Questions: email Tony Holler at tony.holler@yahoo.com or call/text 630-849-8294

Please share so others may benefit.

The post Track & Football Consortium III appeared first on Freelap USA.

Coaching: Maximizing Impact with Communication

$
0
0

ALTIS and Freelap — two of the biggest names in T&F — have come together to celebrate progress in our sport. We hope you enjoy this week’s blog-post. Share if you enjoy it!

Dan Pfaff coaches an athlete at track meet

By Ellie Spain

It’s universally acknowledged that words have power. Effective communication can fast-track an athlete’s learning. Equally important, it builds emotional connections, develops mutual trust, and maintains effective coach-athlete relationships.

The Communication Spectrum

When thinking about communication, many of us think of words alone. Consider the conclusions we make about people based on first impressions. Without realizing it, we scan their clothes and look at their posture and body language. We listen to their accent, the way they speak, and the volume at which they speak. We notice whether they make eye contact. What we see and what we hear mesh together and communicate meaning to us, and we often judge accordingly.

For those of us on the front lines in leadership roles, the ability to communicate effectively through a spectrum of methods–written, non-verbal, and verbal–is imperative. Having the skill to do so in real time without the convenient filters of computer screens and delete buttons is vital. When we interact with others, we cannot take back our words and actions. Time marches on, and the deed is done.

We’ve all listened to people who mesmerize us with their use of words regardless of their message. How do we become better communicators to maximize our impact when coaching, leading, or teaching? What is it that sets remarkable communicators apart from their less effective colleagues?

External Communication: How to Interact with Others

Accomplished Communicators are Minimalists

Effective communicators eliminate unnecessary padding from their message. Just as extraneous details in training schemes can reduce a program’s effectiveness, embellishing our ideas with unnecessary words dilutes the message. We are creatures of deletion and have limited retention capacity in our short term sensory store to hold information. Make sure your message doesn’t drown in your own noise.

Stop, Look, Listen, Observe

Is it a good time to speak?

Knowing what not to say and when not to say it is a hallmark of effective communicators. Likewise, being a diligent and interested listener is key to understanding others.

While listening to really great music, we’ll hear pauses. The pauses are as much a part of the melody as the notes. The same is true of effective speakers. The best orators speak at a pace to suit the message, vary the pitch of their voice, and pause in appropriate places. Don’t be afraid to count to five before answering a question or giving feedback. Silence can be powerful.

Provide Context

When giving instruction, our words have greater impact if we offer a framework of meaning to underpin the message. Make sure athletes understand why they’re doing something. Their buy-in will be far higher. As Victor Frankl said, “He who knows the ‘why’ for his existence, will be able to bear almost any ‘how’.”

Coaching the leg press

Figure 1. Provide context with instruction. Athletes should understand the “why” behind the exercise.

It’s Not What You Said, It’s the Way You Said It

There is a gap between stimulus and response. The stimulus is what we say. The gap occurs when the listener takes cues from the verbal and non-verbal messages delivered and forms meaning from those cues. Mind that gap! Consider the words’ physical and emotional impact. Does the person bristle or relax? How does their face change? Great communicators are great observers.

Know the audience. Due to language and personal, cultural, or other reasons, everyone will interpret the same communication (particularly written and verbal) differently. We have to be conscious of their style and sensitivities. People interpret “what” and “how” differently.

Be Present

Communication is a two-way process. If an athlete is giving us feedback, and we are “listening” while simultaneously typing on the phone, tying our shoe, and sipping a Starbucks, they will not feel valued. Instead, look them in the eye and try to figure out what they’re saying.

Information is gold dust in coaching. Often the athlete is our best teacher, if we listen to them. As Steven Covey said, “Seek first to understand, then be understood.”


Information is gold dust in coaching. Often the athlete is our best teacher, if we listen to them.
Click To Tweet


Internal Communication: The Inner Monologue

Know Thyself

“Know thyself” was inscribed on the forecourt of the Temple of Apollo at Delphi by seven sages of ancient Greece. What does it mean? To be honest with yourself. Translated to a coaching context, have the consciousness to evaluate your skill sets. Know what you know, know what you don’t know. Do something to plug those gaps.

Emotional Control

What presses our buttons? What makes us mad? Understand the stressors, whether they’re locations, people, or words. This allows us to internally control our response to situations. Otherwise we react and vocalize something we later regret. Learning to create helpful internal dialogue and process our thoughts before we externalize them becomes a huge asset for any coach. Especially in pressure situations when the temptation exists to verbally erupt.

Self-sabotage

Although the proverbial devil on our shoulder affects everyone, self-sabotage is a game changer for athletes. Self-talk and self-sabotage are huge factors in both coaching and athlete development. Regardless of the instructions we give or the inspired pep talks we deliver to bolster confidence, if an athlete is listening to their own faulty or negative internal dialogue, we’re fighting a battle with an invisible third enemy.

The Power of Agenda

Despite what we say, the impact of our communications will be limited if people:

  • have a different agenda when we communicate with them
  • have deep-rooted fears or insecurities about the topic being addressed
  • do not have professional or personal respect for us

It’s critical to use communication wisely to build positive relationships and trust before we address difficult topics or offer well-intentioned feedback. No one likes to be told that their view is wrong or their status-quo or beliefs need to adjust. This is true for a technical model in the pole vault as well as a personal matter requiring emotional management.

Finally, as each day passes, people change, and situations change. No two communications will be exactly the same. Be responsive to shifting circumstances and environments.

“The past is a foreign country: they do things differently there.” L.P. Hartley, The Go-Between.

Please share so others may benefit.

The post Coaching: Maximizing Impact with Communication appeared first on Freelap USA.

The 110 High Hurdles: Four Crucial Drills

$
0
0

Hurdler Hector Cotto

By Hector Cotto

The 110 high hurdles is unlike any other sprint in track and field. While running full speed, you must clear ten 42″ hurdles in stride while attempting to reach the finish line first. The event requires speed, technique, and most importantly, rhythm for success.

Over the past ten years, I’ve had the pleasure of working with some very good hurdle coaches and have done my best to pick their brains. In this article, I’ll share a few of the most important drills I’ve learned and explain how to implement them to achieve greater results.

In the 110 hurdles, the keys to success are to keep the hips high (closer to the height of the hurdle) and maintain a forward lean to ensure constant acceleration. Above all, you must run your fastest. Running fast should go without saying. But as you get caught up in the finer details of the event, you often find yourself running down the track thinking about what to do. This is a prime example of what not to do when the gun goes off. Thinking about, and working on, the technical aspects of the race is saved for practice. When it’s time to race, your intention must always be to run your fastest to cross the finish line.

Here are four drills that will help:

  1. 1-step drill
  2. Schery tops
  3. Cycle ladder
  4. Ladji drill

The 1-Step Drill

I learned about the 1-step drill in 2002 as a senior in high school while browsing AOL. I found many drills for improving technique and speed and, naturally, tried everything. I was lucky enough to have a coach that allowed me to experiment in practice, and this allowed me to find my own style and succeed to a greater degree than the average hurdler.

The 1-step drill is still my absolute favorite hurdle drill, and I believe it should be a part of every hurdler’s arsenal. The drill helps mimic the feeling of adrenaline when running full speed over the hurdles. This is very hard to replicate at sub-maximal speeds, but the 1-step drill does this very well in only 7-8 steps, the distance between the hurdles.

Some coaches believe this drill should not be performed because it doesn’t always follow proper mechanics or because it ingrains an improper cut step. In truth, as you begin to perform the drill better, it fixes all of these errors. At first, you’ll find it very mechanical and slow, but over time, you’ll develop a rhythm and establish the habit of reacting to the hurdles. This is exactly how to clear the hurdles at top speed.

To perform the drill, simply set up at least 3 hurdles anywhere from 6-10 feet apart and move through them in a 1-step fashion.

To truly master the drill, first focus on executing proper mechanics over the hurdles:

  1. Lean forward
  2. Dorsi flex
  3. Drive the heel to the hip
  4. Finish extension into the hurdle (through the takeoff leg)
  5. Drive the leg straight down to the track (off the hurdle)


Video 1. Here is a full training session with cues for mastering the 1-step drill.

As an athlete, you eventually want to develop an instant “bounce” over all hurdles. You want to literally glue the heel, while dorsiflexed, to the hip and feel the hips directly on top of the hurdles. This will take many, many reps to master, but it creates the exact sensation that you want. After hundreds of reps, you should not feel the movements themselves. Instead, you’ll the feel of the hip directly on top of the hurdles and have a continuous movement through all hurdles, instantly.

Schery Tops

I call this drill Schery tops because I was introduced to it by former coach Alfredo Schery. Coach Schery was formerly with the Cuban national team and has worked with some of the best hurdlers in the world. The drill is very simple, but may be a little challenging to perform at first because of the timing. The concept is very simple: continue to move down the track in a straight leg fashion to instill the sensation of a proper cut step.

The cut step is the most important step for sprint hurdles as it directly influences the parabolic flight over the hurdle and determines the velocity at which you clear the hurdle.

The proper cut step is placed directly beneath the hips, with absolutely no drop in the hips, at takeoff. This is precisely what the Schery tops help you achieve.

Before attempting the Schery tops, you should be able to perform the straight leg drill.


Video 2. How to perform the Schery tops.

The key to this drill is to allow momentum to take you over the hurdles without extra effort on your part. It will feel awkward because the timing will be so fast and so smooth that the entire clearance of the hurdles will feel off. But if you want to take your hurdling to new levels, you have to forget the old (what you thought was right) and get comfortable with the new and its weird timing. It’s important not to push to clear the hurdles as many athletes attempt to do.

  1. Keep the knees locked
  2. Allow the arms to swing
  3. Raise the heels straight up into the hips (with feet dorsiflexed)
  4. Continue moving with the knees locked

Cycle Ladder

The cycle ladder is a variation of the cycle drill taught to me by my former coach Steve McGill, the best hurdles coach in the world. The cycle drill is designed to help teach the proper cycle over the hurdles and helps develop the habit of continuing to move the limbs throughout hurdle clearance.

The cycle ladder differs in that the hurdles are set at increasing distances to help develop the quick feet required between hurdles without taxing the nervous system too much. The setup also helps those who have trouble 3-stepping get used to taking off further and further away from the hurdle.

To perform the drill, set the hurdles at increasing distances of 2 feet per hurdle. The cycle ladder drill allows beginners to get comfortable with the 3-step rhythm while gradually building their confidence to accomplish this at the regular race distance.
I like to perform the drill with the hurdles spaced 11, 13, 15, 17, 19, 21, 23 feet apart. The feet have to move very quickly between the first 2 hurdles, and the objective is to keep moving just as quickly as the spacing increases and you move down the track.


Video 3. Demonstration of the cycle ladder drill.

When performing the drill, continue pumping the arms up and down and focus on bringing the feet up into the hips (dorsiflexed) and straight back down to the ground. Do not allow the lead leg to swing forward or the trail leg to swing wide. Keep everything tight and moving up and down.

Cues:

  • In mid-flight, prepare to move the feet very quickly on the ground
  • Stay forward, stay forward, stay forward
  • The trail leg should feel like it lands directly beside the lead leg
  • Keep the rhythm the same throughout the drill (take off from further in front of the hurdle)
  • Don’t increase the stride length to cover the distance between hurdles.

Ladji Drill

I’ve only seen this drill performed by Ladji Doucoure of France and, since I don’t know the drill’s name, I named it after him. I began implementing the Ladji drill in my own training with much success.

I’ve seen three hurdlers race who raised my adrenaline because they moved so fast and so aggressively it seemed they could crash at any moment: Renaldo Nehemiah, Larry Wade (former coach of mine), and Ladji Doucoure. In my opinion, Doucoure had the fastest lead leg of any hurdler because there was absolutely no air time when he cleared the hurdles. Many hurdlers have “fast” lead legs, but Ladji was amazing to watch because he was also almost too fast. (Not even possible right?) He often crashed in big meets because the lead leg got so far ahead that the trail leg (hip clearance) had a hard time keeping up. But when he didn’t crash, he usually won.

To perform the drill, turn the hurdle upside down and stand with one foot on the hurdle rail and the other foot behind the crossbar for balance. Shift all your weight forward onto the lead leg and allow gravity to take control as the leg moves down. As gravity pulls the lead leg to the ground, quickly pull the trail leg up to avoid catching it on the crossbar. The drill is actually difficult to explain. Watch the 30-second video below to see how it’s performed.


Video 4. Demonstration of the Ladji drill.

I began performing this drill in my living room over small obstacles. Eventually I tried it during practice. You can perform it with the hurdle at varying heights, but for the best results, use a 42” hurdle height. This will allow you to more closely mimic the split (separation of the legs) in the race. Do not try to jump or clear the hurdle, simply hang your leg on the rail, shift your weight forward, and allow gravity to do the rest.

There are many great drills a 110 hurdler can perform, but these four will give you greater success and faster times. Be sure to follow my blog and newsletter for more at SprintHurdles and, as always, run fast and make them chase you.

Please share so others may benefit.

The post The 110 High Hurdles: Four Crucial Drills appeared first on Freelap USA.

Own Your Mindset

$
0
0

New Mindset Chapter One

By Kyle Kennedy, Strength Coach, Razor’s Edge Performance

As a coach, I run into athletes who suffer mindset issues. What do I mean by mindset issues? A mindset issue occurs when an athlete has a frame of mind where everything seems wrong, unattainable, or overly difficult.

They’re tired of school or work. They’re unhappy in a relationship. The money isn’t coming in. The list seems to grow and grow and grow. We’ve all been there. There are so many things we can’t control. But the real problem stems from how we let it affect us.

I see these mindset issues most often with injured athletes. Injuries and rehab are very trying because they’re physically and mentally exhausting. Our abilities are limited during that period of time, and this affects our confidence and mindset. It becomes really easy to think about, and make excuses for, all the things we cannot do. We completely lose the ability to see the positive things we did accomplish or the important things we need to accomplish.

For example, an athlete rehabbing from a severe knee injury isn’t able to push themselves like someone who is healthy. What they can do, however, is really focus and hope to have the best rehab possible. Be optimistic about quality movements, range of motion gains, or even small strength and stability improvements. These smaller goals are now the most important.

When everything in life goes well, it’s easy to see the good side of things and have a positive mindset about life and athletics. I’m going to have a great lift. I’m going to dominate out on the field. I had a great day, etc. The positive mindset starts to snowball and confidence runs at an all-time high. Everything seems easy, and everything seems attainable. This may not be a zone we can live in all the time, but we should strive for this zone.

From a coach’s perspective, athletes who are in this mindset look different. The way they take feedback is fantastic, the way they attack challenges and goals is ideal. So how do we keep more athletes in this space?

Carol Dweck Mindset: The New Psychology of Success

I often tell people to “Own It.” This means accepting the current situation and being assertive and positive about how to change it. When we do this, we experience a growth mindset, as described by Carole Dweck in her book, Mindset. If our capabilities are limited, we need to maximize our training to match our current abilities. No matter what’s going on in life, if we can’t Own It, we’ll constantly make excuses for everything.

We can own our mindset by treating smaller goals the same way we treat the high-end measurable goals. As coaches, we need to learn how to influence this mental side of our athletes.

The coach-athlete relationship is very important. To achieve the best results, we must trust each other and work very well together. I always try to keep communication lines open. If an athlete has a problem with something I’m saying or how I’m coaching, I want them to know they can talk to me about it.

This is how I helped one of my athletes recently. This athlete is extremely dedicated and hardworking, and I’ve been working with him for years. He has a few minor injuries which have hampered his ability to train at the level he wants to given his upcoming competition schedule. During one session where he was clearly frustrated, he mentioned several things he was unhappy with personally.

Instead of letting him continue on this path, I sent him a message afterward letting him know how different his attitude seemed and how important a positive attitude was for his training and his life. He told me how much he appreciated this. And I believe it helped him take control of his mindset and approach. Sometimes athletes get so wrapped up in everything in their lives, it’s hard for them to notice how negative they’ve become. All they need is a reminder to work on it by themselves or seek the help of others.

Another way a coach can help maintain a positive, competitive mindset is to create an environment with both short term and long term successes. If an athlete has a goal to make the Olympics in four years, they will surely experience periods where success seems unattainable or too distant.


Coaches can do more than just teach technique; they can create environments for success.
Click To Tweet


As a coach, it’s important to create successes during macrocycles, microcycles, and even individual sessions. We need to do more than just teach technique, we need to create environments for success. If athletes feel they’re succeeding and accomplishing challenges, their positive mindsets will flourish.

No two athletes will be the same, and no two days will be the same. Our ability to train and compete is limited by what our mind and body are able to accomplish on a specific day. If we can be aware of our abilities and own our mindset each day, we’ll have no reason to feel frustrated with a training session or disappointed with a result. Coaches and athletes, let’s be positive and attack our goals, no matter how limited or small they may seem.

Please share so others may benefit.

The post Own Your Mindset appeared first on Freelap USA.

Performance Therapy: What Is It and How Is It Applied?

$
0
0

ALTIS and Freelap — two of the biggest names in T&F — have come together to celebrate progress in our sport. We hope you enjoy this week’s blog-post. Share if you enjoy it!

Gerry Ramogida and coaches

By Gerry Ramogida

If you have followed the ALTIS Twitter feed and read Facebook posts or other articles on this blog, you have likely seen the term “Performance Therapy,” with some description of how therapists are integrated into the training environment. But what is really meant by Performance Therapy? Is it a case of simply having treatment provided trackside, or is there a rationale or process by which the types and timings of inputs are governed?

The Foundation of Performance Therapy

Performance Therapy began out of necessity. Coach Dan Pfaff, a teacher both at heart and by profession, has always promoted a daily focus on improving athlete movement patterns to progressively improve the athlete’s ability to demonstrate the skill of sprinting (or throwing, jumping, etc.). It is the focused, purposeful repetition of a skill that brings the skill to a stage of automation and ultimately transforms an individual from a novice to an expert performer who displays mastery across a variety of environments and conditions.

Coach Pfaff initially worked at the high school level, with limited budgets and available services. He was responsible for programming, S&C, maintenance of facilities, and any other function needed to run a track and field program. This also included helping athletes manage nagging symptoms or injuries. A voracious reader, Pfaff used books to learn basic massage and gentle joint mobilization techniques, as well as PNF and other therapeutic modalities. Coach Pfaff observed very quickly that, as athletes improved their mechanics—helped by his brief inputs—performances improved and injuries resolved.

This was the starting point of Performance Therapy.

As it evolved over the years, and attracted a generation of therapists, it was not uncommon at the University of Texas to see Coach Pfaff educating visiting therapists on sprint mechanics. He contended that, if you understood the kinetic and kinematic models the athlete was working toward, you could recognize aberrations in movement patterns away from the model. Then, given a detailed knowledge of anatomy, you could determine which structures require attention in order to improve the observed movement pattern. Pioneers on this front, such as Dr. Mark Lindsay, D.C., and Dr. Mike Leahy, collaborated with Coach Pfaff, and the foundations of Performance Therapy were established. Its beginning corresponded with numerous world-class results, such as Donovan Bailey’s world-record 100m run at the Olympic Games in Atlanta.

The Performance Trinity

As a new chiropractor, I stood spellbound, watching Coach Pfaff work with Donovan Bailey, Bruny Surin, Mark Boswell, Obadele Thompson, and a host of other great athletes from numerous sports. Pfaff stated, “If you have a coach, athlete, and therapist working together, you will be successful. It’s all you need: The Performance Trinity.”


The Performance Trinity—coach, athlete, and therapist—is the foundation of Performance Therapy.
Click To Tweet


To improve performance, each member of the trinity must have a common understanding of the mechanical model the athlete is working toward. With a common understanding, communication becomes consistent and each member’s input is complementary to the desired goal. Within the trinity, any aspect dictating performance becomes a “currency” of communication and understanding. Mechanics, sleep hygiene, nutritional strategies, recovery strategies, etc., must all be actively understood and reinforced by all members, including the athlete. Athlete education in relation to each currency is essential so that each member is accountable for doing their part to ensure all efforts work to optimize outcomes.

Performance Therapy

Observation of Movement

The daily observation of mechanics guides Performance Therapy input. Observation of the athlete’s movement begins the moment they walk from the parking lot to the track. Much can be gathered through observation. Mood, energy level, general posture, fatigue level, and gait fluidity are just a few of the qualities an attentive eye can capture—especially when this becomes a daily practice and a familiarity develops within the trinity. Obviously, accuracy of athlete reporting is of great value, but observation by the coach and the therapist are also important to help create a baseline behavioral profile of “normal” for that athlete. When observations fall outside normal, further investigation/questioning should follow—and this is just pre-session observation.

Observation continues throughout the entirety of the session. With a shared model of event mechanics, and a knowledge of how each menu item in the training session is designed to contribute toward improvement of that skill, active observation is continuous from walking drills to dynamic drills and through to event-specific activity. Athletes at ALTIS have consistent components to their daily warm-up, including various drill and mobility progressions. This warm-up gives the therapist, coach, and athlete an opportunity to perform a daily “Living Movement Screen” through multiple planes of motion and thresholds of effort.

The coach and therapist both observe movement quality while the athlete is actively noting kinesthetic findings. In this manner, aberrant or inefficient movements can be recognized. Specific intervention depends on the time of year, purpose of the session, etc., but can include coaching queues, a comment to refocus athlete attention, or a brief manual therapeutic intervention. The ongoing process employed is always: observe, treat, re-observe.

The ultimate goal is to improve or maintain an athlete’s quality of motion throughout a session, from start to finish. When this occurs session after session, consistency of training is the result. Coach Pfaff states that training gaps are the biggest impediment to performance. Consistent, purposeful, high quality practice leads to mastery of a skill, and ultimately leads to consistent high level performance.


Consistent, purposeful, high quality practice ultimately leads to consistent high level performance.
Click To Tweet


Timing and Immediacy

One of the key components of performance therapy is immediacy. Immediacy refers to the capacity to provide an input in an attempt to improve movement quality and then have the athlete immediately return to the motor task. It is known that manual therapy can influence mechanical characteristics of movement such as range of motion and joint mobility. However, the transient increase in afferent input from the treatment input to higher cortical centers (somatosensory and motor cortices) is perhaps the greater influence, as it increases the athlete’s ability to incorporate the acquired/improved ranges into their movement pattern.

Dr. Rick Celebrini states, “Manual therapy creates a transient window of increased proprioceptive awareness during which we can improve movement quality and motor patterning. If we are not taking advantage of this window, what are we doing?” It is my belief that, through daily focus and collaborative effort to improve movement mechanics, gradual improvements are made in skill expression that show as greater movement proficiency, resulting in improved mechanical efficiency. With improved proficiency and efficiency, we observe corresponding improvements in performance and a decrease in injury frequency.

Performance Therapy Applied to Sprinting

Current research is confirming the existence of a common mechanical model to accomplish maximal velocities, and this model is shared by the world’s fastest sprinters. Clark and Weyand stated in 2014: “We found that the fastest athletes all do the same thing to apply the greater forces needed to attain faster speeds…[and] our data indicate the fastest sprinters each have identified the same solution for maximizing speed, which strongly implies that when you put the physics and the biology together, there’s only one way to sprint really fast.” Similar conclusions have been made by others, including Dr. Ralph Mann and Dr. Frans Bosch. Dr. Deborah Sides, a biomechanist who was employed by UK Athletics in the period leading up to the London Summer Olympic Games, performed exhaustive research into the kinematics and kinetics of elite sprinting—providing detailed data of athletes traveling over 10 m/s—and determined the same thing.

There are a number of characteristics identified as indicators or predictors of successful sprinting. To list and describe them all here is beyond the scope of this current article; however, some of these include maintenance of posture, maintenance of dorsiflexion through swing phase, degree of hip extension at toe off, height and duration of knee drive to the point of maximal hip flexion in swing phase, and positioning of the free leg in relation to the stance leg at mid stance, to list just a few. The evaluation of athlete performance against these and other key indicators is part of the observe, treat, re-observe process, always striving toward optimal.

In living systems, there is a general rule that a biological system will search for the most energy-efficient solution to a task. Once an energy-efficient solution has been found, it repeats it. The convergence upon a common strategy to run fast is an example of this. Sprinting demands the delivery of large amounts of force over increasingly shorter periods of time.

At maximal velocity, the ground contact time of world-class sprinters will be less than one-tenth of a second. In that time, they will produce forces three to five times their body weight on a single leg. Production of such force demands muscular effort, efficient production, and the return of elastic potential created within the fascial system, as well as the execution of precise timing and placement of these forces. It may seem obvious, but the execution of correct mechanics places the athlete’s anatomy (joints, ligaments, tendons, musculature, functional chains—the entire myofascial and musculoskeletal system) in the most advantaged position to accomplish this.

Given the significance of the forces involved, it is not difficult to deduce that aberrant mechanics will increase an athlete’s risk for injury and reduce the ability to produce the necessary forces required for success. A joint complex not efficiently oriented (e.g., everted calcaneus, externally rotated femur, reduced thoracic rotation, etc.) acts as a weak point in the chain, bearing increased stress and potentially leading to injury at this or a related site. Through daily observation, it is our goal to recognize any potential “dysfunction” as it presents, and work to reduce its impact on performance, with the ultimate goal of correction.

An Ongoing Collaborative Process

Performance Therapy is a part of ALTIS’s overall program. Performance Therapy is practiced in all training environments, from the track to the gym. It does not replace clinical work. It does not eliminate the need for proper S&C, or any other component of standard training and practice. Instead, Performance Therapy is “an ongoing collaborative process involving Athlete, Coach and Therapist working to normalize function by integrating manual therapeutic intervention into the athlete’s sporting movement practice, resulting in performance improvement and injury reduction by focusing on and affecting technical proficiency and mechanical efficiency” (Pfaff, McMillan, & Ramogida, 2014).

Please share so others may benefit.

References

Clark, K. P., and P. G. Weyand. “Are Running Speeds Maximized with Simple-spring Stance Mechanics?” Journal of Applied Physiology 117.6 (2014): 604-15. Web.

Sides, D. L., Kinematics and kinetics of maximal velocity sprinting and specificity of training in elite athletes, PhD thesis, 2015, University of Salford.

The post Performance Therapy: What Is It and How Is It Applied? appeared first on Freelap USA.

How to Calculate Relay Exchange Marks

$
0
0

Relay Baton Handoff

By Roger White

Imagine your first day of practice. More than a foot of snow on your track and temperatures below 30. You have 3 weeks to prepare for your first meet, and likely won’t even see the track for the first week. You pray for warm weather and it finally arrives. The snow melts and now you have less than 10 practice days to get your team ready. Who do you put in the relays? What order? What takeoff marks will they use? This is the situation nearly every high school coach in the northern US faces, including me here in Metro Detroit.

In 2012, I had a great group of boys, all juniors, who had shown the potential to do big things. In previous years, when it came time for relay handoffs, I backed a kid up a distance that “looked” right, told the outgoing runner where to start and made a takeoff mark, and used trial and error to determine what worked. Sometimes it quickly came together, other times we needed dozens of exchanges. Being particular about training and taking into consideration how many fast runs kids can do in a given practice, this lack of consistency irritated me. I’d often stop a session if the marks were not correct because the runners had already done half a dozen attempts.

I tweeted a US 4×100 member about how he figured out steps on short notice (I believe right after a relay in Monaco). He replied something to the effect of just knowing where to stand and when to go. I felt there had to be a better way, but what? And what happens if someone gets hurt and I need to either change the order or substitute another guy? This would require additional practice and additional fast runs that might—or might not—be helpful. Also, when our team attends weekend relay meets with odd distance combinations, we have to practice all those different exchanges too.

That 2012 season ended with my juniors missing state finals qualifying by a few tenths of a second in both the 4×100 and 4×200. I was ready to figure something out to get them there the next season.

Help from the GDR

In the off-season, I always read new books and re-read old ones. One of my all-time favorites is Track and Field: Athletics Training in the G.D.R. (East Germany) by chief editor Gerhardt Schmolinsky. Schmolinsky was the best hurdler of the newborn GDR during the 50s. He later became one of the leaders in sport education. The chapter on relays included a table to determine relay takeoff marks. Maybe the scarcity of training information from the DDR made it exciting, I’m not sure, but it was the best I had my hands on. So I decided to give the table a try.

Track and Field Athletics Training in GDR

Figure 1. Track and Field: Athletics Training in GDR

The book credits the table to Tom Ecker in Der Leichtathletik, no 13, 1969. (I consulted Pierre-Jean Vazel for assistance, given his incredible knowledge of the history of track and field.) Der Leichtathletik was the official GDR track and field magazine. It included two pages of one or two articles about training, usually German translations of foreign papers. Ecker was the coach at Western Kentucky University and also a successful writer.

In the 60s, he was a part of the American Specialist Program, doing clinics in Finland, Sweden, and Iceland. He impressed the Swedes, who later named him national team coach. He went on to write Basic Track and Field Biomechanics. In a conversation with Coach Ecker regarding relays, he felt the fastest runners should go first and the slower ones last to take advantage of the free distance in the first leg and the shorter anchor distance in the anchor leg. In the book, he adds that consideration should also be given to those who are great starters and curve runners.

Figure 2. Basic Track and Field Biomechanics

Figure 2. Basic Track and Field Biomechanics

The table in the GDR book was part of Ecker’s formula for calculating the “go distance.” His formula showed takeoff distances based on the incoming runner’s last 25m speed (A) and the outgoing runner’s 26m acceleration time (B). From those times, a go distance (G) could be marked and used for 4x100m relay exchanges.

The Ecker equation for aggressive exchanges is

G = 75(B – A) / A

For safe exchanges, 75 becomes 60, B is 21m, and A is 20m.

G = 60(B – A) / A

How did I use these tables?

I teach math and anything number-related excites me. Early in the season every year, I do time trials of 30m, 60m, and 80m (I don’t like timing actual race distances, as some kids freak out when times aren’t near their race performances). I decided to use the data from these runs, find the table values, and see what happened in our first relay practice. I know studying elite athlete training theory and applying it to high school kids can be tricky. I knew there had to be some factor to account for in these numbers. So I timed the first 26m of their 30m and the last 25m of their 80m.

Originally I used hand times. Here is how things worked out. Runner “E” ran a 3.25 26m and a 2.63 25m fly time. Runner “A” ran 3.22 and 2.53. “A” handed to “E,” so I took A’s 2.53 seconds and E’s 3.25 seconds, added .24 for the hand-time factor, and that gave me 2.77 and 3.49 (rounded to 2.8 and 3.5 on the table). That gives a go distance of 6.3m (20.66 feet, or 22 shoe counts). I now use a Freelap timing system, so data is very easy to collect during these trials.

In practice for baton passes, I start the incoming runner approximately 30-40 meters away, as I feel this resembles the speed toward the end of the leg based on some hypothetical velocity curves. On our first attempt, timing was pretty much dead on in the exchange at full sprint and full reach. This worked for the other runners as well. Our kids started at the back of the acceleration zone, used the full 10 meters to accelerate into the exchange zone, and the exchange took place in the middle of the zone (after about a 20-meter sprint by the outgoing runner.)

Sometimes in the season, we run in relay-type meets that combine odd distances are run together. Often there are 100-100 exchanges and interchanging guys is relatively easy using these marks. Once the meets get going, I still use these original time trial times because I don’t have to re-run a guy or continue to update marks.It gets me within 1-2 shoes using the full zone, and that is what I’m after in exchanges—get the kids running as fast as they can with a nice reach to exchange the baton.

Since utilizing this formula, my kids have broken three school records (both boys’ relays, and girls’ 4×200). Our boys recorded the fastest 400 meter relay time in county history, the first team under 43 seconds. In preparation for big-meet environments, we practice exchanges while other kids run next to each other in other lanes at various speeds to combat the chaos of the race and pressure of all the fast teams. For example, we practice situations with other runners in front of us to simulate being behind and not wanting to take off too soon in a panic.

What about the tables for 4×200?

I have used the equations for the 4×200 as well. In races, I record each runner’s last 20 meters using video software. I find a place near one exchange zone and have another coach/athlete stand at the other side and we get video of the exchanges. Using the 20-meter mark is often easy because of the existing relay marks on the track. Since it’s easier to get the outgoing times, we time those in practice. With both numbers now calculated, I determine precise go distances and rehearse them in practice.

Please share so others may benefit.

Author information

Roger White

Roger White

The post How to Calculate Relay Exchange Marks appeared first on Freelap USA.

Planning Year-Round Training: Don’t be Married to the Paper

$
0
0

ALTIS and Freelap — two of the biggest names in T&F — have come together to celebrate progress in our sport. We hope you enjoy this week’s blog-post. Share if you enjoy it!

English | 中国语文

Sprinters During Recovery

By Rohsaan Griffin

Planning a long-range training scheme is a complex task involving multiple layers of progressions, plans, and contingencies. When considered carefully, long range plans can serve as blueprints to mold and direct athletic potential, similar to a roadmap to provide direction between a start and end point. The exact route and speed of travel, however, is something we must be prepared to adjust along the way.

This is the art of coaching. We create the blueprint, or roadmap, while using our judgment to make adjustments to maximize the athlete’s chance to reach planned goals. Nothing is set in stone so firmly that we can project future development of a human being with 100% accuracy.

ALTIS Coach Rohsaan Griffin

Figure 1. ALTIS Coach Rohsaan Griffin

From my perspective, we have three key objectives when thinking about a plan:

  1. Preparation for optimal improvement and performance
  2. Preparation for a competition peak
  3. Preparation for the major competition within that peak

There are many possible approaches that could achieve these three outcomes, but I believe we need to be very intrinsic with our approach. In other words, keep everything very related and specific to the goal we are trying to achieve. There is no room for nonessential elements in any training program.

Many coaches, however, believe they must build a base into the training process. This results in lost months of specific skill training. When following these paradigms, are coaches are using common sense in the training process or are they blinded by “book sense”? Too many coaches are married to the paper in this respect. We have to plan our work and work our plan. If something isn’t working well, plan B or plan C should be implemented. We should not only collect the greatest training logs and articles written and try to liberally apply them out of context and think they’re going to work for an individual athlete.


Coaches should tailor training plans unique to each individual with progressions and contingencies.
Click To Tweet


During my time as a competitor some years ago, I was part of one of the greatest training groups ever assembled. It included Donovan Bailey, Obadele Thompson, Bruny Surin, Glenroy Gilbert, Kareem Streete-Thompson, Donovan Powell, Vincent Henderson, and myself. On any given day, each of us trained differently because each of us was catered to individually. I firmly believe a coach should plan this way. Whitewashing a one size fits all plan onto athletes, just because they are training for the same event, is not logical.

Instead, I suggest that plan individualization should be based on the following:

  1. Analysis of the previous year
  2. Preparing the body for the imposed training demands
  3. Global body conditioning using strength, mobility, and endurance
  4. Modification or consolidation of technique

First, an analysis of the previous year’s performances is critical. This allows us to gauge which elements should remain and which should be removed from the proposed year’s training plan. Since my current group of athletes began their training, I have both added and taken away from their training loads and training menus. This rolling fluctuation occurs because their stages of development have changed. In the two-and-a-half years I’ve been coaching in China, our training has evolved immensely as mastery of landmark skillsets occur.

Second, getting an athlete fit to train at the required intensity is one of the most important factors in the process. And rightly so for many reasons, including the impact on injury prevention. As coaches, we must be both cognizant and respectful of individual timelines rather than blindly push the limits of getting them “there” faster. This process has a very delicate tipping point, and mismanagement and overtraining can lead to unsatisfactory outcomes.

If an athlete is not hitting the times required in training, either adjust the time or adjust the rest interval. If the athlete is laid out on the track after the workout because we did not see indications of an immediate downward spiral during the session, we’ve lost on both ends. We haven’t achieved the objectives of the day’s training and we’ve destroyed the chances of having more productive workouts during the remainder of the week.

Third, considering the body’s conditioning and strengthening in its totality is very important. We can’t overemphasize the training of one group of muscles and neglect the others. A well thought out approach should include every major muscle group in a manner that’s specific to the event’s demands.

When I first arrived in China for ALTIS, I was abruptly thrown into a situation where I had to evaluate a new group of athletes. I had not selected or recruited them. They came from many different groups, bringing with them varying skill sets and exposure to a multitude of coaching philosophies. Needless to say, I had to start from ground zero. My first priority was to start with the most basic, generic training protocols possible so I could determine each athlete’s skill sets and deficiencies.

For example in China, they live and die by the squat, but that’s all they can do. Moreover, poor technical form in the lift often bleeds over to poor posture and form on the track. This leads to injury over the long run. My approach to developing global conditioning is very different. I started the athletes with simple explosive movements such as box jumps, standing bounds, medicine ball throws, kettlebell squats, goblet squats, and hurdle hops for two solid years. This fall was the first time any of my athletes put a bar on their back, and I’m proud to say they remained injury free. They were also much stronger than their counterparts who spent the last two years squatting.

ALTIS Coach Rohsaan Griffin training athletes in China.

Figure 2. ALTIS Coach Rohsaan Griffin training athletes in China.

Technique, another essential element, requires monitoring and adaptation to maximize performance potential. It’s as essential in the weight room as it is on the track. Poor form in any exercise infects other movement patterns, leading to poor habits, substandard performance, and increased incidences of injury.

I am very particular about this because of my personal experience. I was mentored and trained by coaches with an incredible eye who learned to dissect movement to its most intricate level. We have to be careful to not overcoach and over cue in our quest for movement utopia. The true sign of a great coach is that all of their athletes look essentially the same while running. There will be slight variations, but overall, they look the same.

Three coaches who I highly regard are Tom Tellez, Dan Pfaff, and John Smith. Every athlete coached by these guys looked technically the same. They were clones of each other with different ability levels. The athletes’ movement expression demonstrated a clear coaching system.

How do we get athletes to do this? We can’t just be the coach with the watch that says “Go run” and expect things to magically fall into place. It won’t happen. If it takes breaking down the simplest movement and drilling it repeatedly every day until we see a change, then do so. Once that movement is mastered, move to the next deficiency and work that. Never try to fix everything at once. When a few things click at the same time, mesh them together and reevaluate what’s next.

Finally, the plan must include competition specific conditioning. This is totally different from the general training regimen. In this phase, we have to train for a competitive peak and make any necessary last minute adjustments. After all is said and done, we debrief our athlete, implement an active rest and recovery plan, and start the process again for the following year.

Unfortunately, many coaches don’t treat athletes as individuals and assume they can train every athlete the same. Nothing is further from the truth. Think outside that little piece of paper, don’t get married to the plan, and make time to look up and see the people behind the paper.

Follow these guidelines when you’re planning the training, and I’m certain you will find success along the way.

Please share so others may benefit.

ALTIS Elite Athlete & Coach Training Environment web link

Author information

Rohsaan Griffin

Rohsaan Griffin

The post Planning Year-Round Training: Don’t be Married to the Paper appeared first on Freelap USA.


The Speed Reserve Algorithm: A Simple Way to Attach Meaning and Significance to Sprint Workouts

$
0
0

Anaerobic Speed Reserve

By Ken Jakalski

I very much agree with Carl Valle’s insights on assessment, as wells as my Illinois colleague Tony Holler’s insistence on recording, ranking, and posting sprint times.

Since 2004, what has helped me in applying their approaches has been using the Bundle/Weyand speed regression algorithm in designing speed workouts for my sprinters.

The algorithm is related to research investigating what limits sprint exercise performance. The classic explanation has been that speed decreases as the event duration increases because of an energy supply limit. Researchers assumed that, if energy limits all out performance and we increase energy supply, performance will improve. Likewise, if we decrease demand, performance will improve. That explains why many speed coaches still target supply and demand, which I now describe as the “kind of training Tony Holler hates” because it results in, as Tony notes, “stupid coaches having the hardest practices.”

Even as far back as 1925, the legendary A.V. Hill questioned whether this energy supply conclusion applied to sprinting. “It is obvious that we cannot pursue our (energy supply) argument to times below about 50 seconds,” said Hill. “These performances are limited by factors mechanical and nervous.”

A V Hill Timing Gates

Despite Hill’s suggestion that high-speed performances need to be looked at differently, even to this day, there are many who continue to accept the classic notion of why speed declines over time. After all, it did apply to distance running, and why consider alternatives to an approach that prior to 2003 nobody was considering, perhaps because there was no energy data available for sprinting?

Bundle and Weyand put forth their view in the 2012 article, “Sprint Exercise Performance, Does Metabolic Power Matter?” Their conclusion was that speed declines as a result of musculoskeletal force output. They continue to use a simple analogy to explain what they mean. Is the (horse)power source (a car engine) limited by the fuel supply (ATP) or the transmission (muscle, tendon, and bone)?

For sprinters, reducing fuel supply has no effect on speed. Changing mechanics does. In their words, “energy release in sprinting is demand driven and not supply limited. It is at this point that speed coaches like Tony Holler would be saying, “I told you so.”

If performance in sprinting does depend on force application, how can we apply good science to improve performance? Certainly, fast, short repetitions make perfect sense, in combination with strength work, and the mechanics that recent research from Dr. Ken Clark indicates what it is that elite sprinters are doing at high speed.

What I do, by way of the original Bundle/Weyand research, is to use the force approach—or speed reserve by way of the algorithm presented in their 2003 paper, “High-speed running performance: a new approach to assessment and prediction.” What appears below is the table version of that algorithm I use with my sprinters. The table will generate speed projections at my distance of choice for each sprinter on my team, after inputting two measurements: each athlete’s top sprint speed (by way of a fly-in 10 or 20-meter sprint, and top aerobic speed ( by way of a 300-meter sprint).

ASR Chart

What ASR does for me is to provide individualized, specific goal times for my high speed/short repetition workouts. My tables also list a termination time for each athlete. That “fall-off” time reflects a drop in speed that changes the focus of the workout. Athletes could continue to run reps, but when the speed drops below a prescribed percentage (like 4%) athletes are could keep doing reps at slower and slower speeds, and that can quickly become the kind of workout that, as Holler might say, “takes the “cat” out of sprinters.”


The ASR algorithm provides individualized, specific goal times for high speed/short repetition workouts.
Click To Tweet


Do coaches need this kind of specificity to achieve what Dr. Weyand describes as “attainable intensity”? Probably not. Fast running is fast running, and “100% intensity” perhaps needs no additional qualifiers.

I have found that my athletes concentrate better when they have a specific target for the workout and are certain of what is expected from these kinds of formative assessments. It’s the way I try to ensure that, in Coach Holler’s words, “low effort never happens in speed training.”

ASR helps me to accomplish what Holler believes is essential to a successful sprint program: demanding quality and making times meaningful.

Editors note: To perform your own ASR Calculations, see the online Sprint Calculator and User Guide.

Please share so others may benefit.

References

Bundle, Matthew W., Reed W. Hoyt, and Peter G. Weyand. “High-speed Running Performance: A New Approach to Assessment and Prediction.” Journal of Applied Physiology 95.5 (2003): 1955-962. Web.

Bundle, Matthew W., and Peter G. Weyand. “Sprint Exercise Performance.” Exercise and Sport Sciences Reviews (2012): 1. Web

Clark, K. P., and P. G. Weyand. “Are Running Speeds Maximized with Simple-spring Stance Mechanics?” Journal of Applied Physiology 117.6 (2014): 604-15. Web.

Author information

The post The Speed Reserve Algorithm: A Simple Way to Attach Meaning and Significance to Sprint Workouts appeared first on Freelap USA.

How Velocity-Based Training Improves Swimming Performance

$
0
0

Breast Stroke

By Carl Valle

When I saw the 1080 Sprint on video, I wanted to be among the first to test it. For many years, swimming performance was reduced to splits in races, and now the future is maximizing swimming velocity with smarter approaches and using the right technology.

1080 Swim

Figure 1. 1080 Sprint at pool side.

Time for a change from Pace clocks

I love pace clocks. They formed the backbone of swim training for decades. I see some today that are older than I am and still function perfectly. Every time I am in the pool they remind me how efficient coaching swimming is because everyone is synchronized to the near second. Pace clocks are perfect for intervals but they are not the end game. The problem with pace clocks, though, is that they show time but don’t get time. A pace clock is often used to eyeball a split in training, or coaches do a half-hearted time trial with a one-off hand-time measurement with a stopwatch. In order for the sport to improve, innovation is going to come from having a better reading on problems and challenges of improving mean swimming velocity, not just if an athlete is making the workout intervals.

More Precision, More Possibilities

Coaches ask me about the key benefit of moving from interval timing, or send-off times with pace clocks, to getting velocities. The answer is precision. When training, athletes and coaches want improvements in mean swimming velocity, not just an indication they are “making the times” or even getting a time. The main point of this article is to value mean velocity, measure it, and then improve it. Just getting the total duration of the swim distance isn’t going to work anymore.

An increase in mean velocity is about training better, not about race analysis. I will review the differences later. The different phases of the race make mean velocity inappropriate for evaluation, but it does matter for global or raw training, day in and day out. For the sake of simplicity, I will focus on the core of swimming: the ability to maneuver above the water in a more efficient and effective way.

The ability to time each length to fractions of a second opens doors to countless opportunities. By adding heart rate or physiological effort, even a simple workout now gives information that in the past was too much of a burden to worry about. Coaches and athletes can get valuable insights into training—far more than just a random assessment—and every interval is now captured.

History of Velocity Concepts and Swimming

Freestyle Swim Profile for 200m

Figure 2. In 1985 Bill Boomer was already focusing on body velocity with his his educational resources, and really got people thinking about improving swimming speed with stroke characteristics.

History, if properly documented and recorded, is part of the proxy to truth like science. After using the video camera become widespread, history became more and more real because it could document what others could not be present to see.

In swimming, important history lies in the American Swim Coaches Association (ASCA) World Books. They provide my favorite reading because they are transcribed manuals of presentations from some of the masters. I say this over and over: to become a better coach, buy a few their world books and expand your knowledge. For 50 years, ASCA has made coaching a true art form with science as a beacon of light.

In 1985, pioneering swim coach Bill Boomer presented velocity concepts. He did an amazing job of getting everyone exposed to the underlying factors of distance per stroke and cycle count. Swimming is more technique and artificial compared to sprinting, an event that is very reflexive. He showed how teaching and training improve mean velocity. In 1995, ten years after Bill’s presentation, my thoughts started migrating to body speed, since most measurements are about rate, not total times. It wasn’t until 2000 that I actually used velocities in training after seeing Inge de Bruijn dominate the Olympics.

Parametrix Race Analysis and Software

Senior Regional ASCA

Figure 3. This chart of former world record holder Inge de Bruijn was instrumental to me to think smarter about metrics that were root causes of surface level analysis.

After the 2000 Olympics, a few smart coaches started talking about race evaluation beyond splits. Soon race modeling became far more powerful with software that could measure the metrics behind the race. Instead of looking at splits every 50m, the new normal was looking at details such as how they swam every length versus what they swam velocity wise. I was coaching both high school swimming and track and wanted something that could help me get into root speed development versus just conditioning athletes with “hard workouts”.

My assistant, a genius in business intelligence and deep knowledge of sport, started pushing me to see more granularity behind why some people are fast and what can be done with their slower counterparts. My assistant to this day is my biggest influence when an innovation drought occurs and I need growth in areas most are not even aware of. His mantra of always breaking new ground when the rest feel like they reached pay dirt or rock bottom is my new guiding principle. Dig deeper.

The early 2000s was a perfect evolutionary caldron of brains and ideas that produced some state and school records over a 10-year span. I wasn’t so much of a coaching mind but was clever enough to find innovation outside my own limited abilities. My core belief with long-term development is the following:

Many athletes get better from any training with just time alone, but the name of the game is knowing the best way to maximize the probability of having athletes reach their full potential.

I have been gifted with talented kids who got better because they got older and didn’t get hurt along the way, but that is a waiting game, not coaching. I am not too big to admit that winning the genetic lottery a few times and that attracted more talent, but getting better is getting grounded truth or deep insight.

As sport science moved from the 1990s to the early 2000s, so did the rise of data in sport. Moneyball was part of the evolution, not its cause. Since the dawn of time, recordkeeping—be it tally marks on a bone or the best database in the Australian Institute of Sport—data and analysis have always been there. Coaches must know that the human element is a starting point, not something to be proud of.

Current Swimming Performance Methodology and Evaluation

As we approach the 2016 Rio Olympics, the margins among swimmers internationally are narrowing. Every inhabited continent is now a player, and the US and Australia are not the only powerhouses. After a disappointing 2015, the US needs a wake-up call. Some are saying that the results were a fluke, or that people are waiting for 2016. Time will tell, but the truth is that US swimming needs to innovate or find itself—like the early 1990s—in a period of transition.

With Europe using better swimming technology than the US and most of North America, the consumer sports tech is throwing a hat into the equation with data and sport science. Coaches must start doing the following:

  • Gather novel data that is valid, precise, and accurate
  • Create key performance indicators for their athletes
  • Create benchmarks and milestones for their program
  • Monitor and manage training daily and weekly
  • Evaluate the training system annually

Many possible avenues coaches can take, but a straightforward and more probable approach is to assess velocity components. A smart perspective in modeling is measuring simple qualities and see what can be done to improve the components, and see if the transfer happens when athletes are racing and training.

What the 1080 Sprint Measures and What it Trains

Several coaches asked in swimming if the 1080 Sprint could be used for aquatic sports, and the news was clear. The overspeed and resistance of their speed trainer is not thing new, but the real evolution was the concurrent sampling of stroke-by-stroke data live during training. In the past giant elastic cords or old selectorized weight stacks would create assistance and resistance, now a high precision motor could dial up to any velocity one needs. While buckets and other options have been around for decades, coaches are looking for “precision medicine” and not dated solutions. Simply summarized the 1080 Sprint offers the following training benefits:

Resistance Loading — Most coaches are comfortable adding drag or resisted load in swimming. Just like coaches on land adding resistance to sprints, swimming has always been about the dichotomy of adding resistance and increasing efficiency. The unique and differentiating aspect of the 1080 is the smooth resistance can be variable during the swim and instantly change from a tablet. Those doing rep after rep sprints can throttle up or down the resistance to fine tune the training stimulus.

Assisted Pacing — A less commonly known benefit is going at a high velocity with a lowered effort to learn rhythm and relaxation at demanding speeds. The velocity is not faster than normal, it’s just fast but easier than normal and this can be an opportunity for some intriguing motor learning changes.

Overspeed Options — Some interesting theories exist with greater than volitional speeds and how that transfers without the assisted towing, but the reality is we don’t know the exact science behind it. Anyone with enough towing force can swim faster than world record pace, so the true winning formula is to see why less than world beating swimmers are not hitting specific velocity. Many near elite swimming athletes may learn to accommodate the speed by exposure, but the key is that the coach must decide this process with care and experimentation.

In addition to the training features, the 1080 Sprint system is a mini-sports lab, designed to be very practical and extremely portable. While training the athletes, data from every surge or propulsive stroke is captured with tension sensors to collect the essential (and elusive) power readings. Coaches are always tinkering with stroke technique, and the idea is to see how power surges can create a mean velocity that is higher and more efficient for races.

At this point some coaches are already ahead of the curve and have the advantage of what is possible, but expect a Cambrian explosion soon as the instrument grows in adoption.

Modeling and Improving Velocities with the 1080 Sprint

Turning and Swimming Components

Table 1. The swimming research is always interesting and enlightening when they present underlying performance data. Note the focus meters per second, and not splits. In this study the researchers looked at the four strokes in the 200m and analyzed their walls and free swimming velocity to extract patterns in performance. (Source Veiga 2015)

Distance and sprint swimmers, serious triathletes, and recreational fitness enthusiasts can learn a lot about the relationship between velocity and the physiological response from the strain of it. Using time, distance, and cardiovascular response are a direct way to get answers to basic questions. I’ve already discussed modeling in an earlier blog, so I will be brief here.

Coaches need to know how quickly swimmers can reach maximal speed above the water and how to conserve it over time. Some are blessed with faster speeds, some with better endurance, and both can be improved with better swimming practices.

Michael Phelps is probably the best example of long-term development. Since he was a child, he has worked with the same coach. The combination of his innate talents and consistent coaching direction from his coach explains why he is the most decorated Olympian.

No one may ever replicate those feats, but we need to do things a bit better by obtaining pertinent information. If you ask your average swim coaches how fast their swimmers are, most rattle off an event time. Down the road I think people will get velocities and show how they are improving both the peak and mean outputs.

A simple step of knowing basic peak and mean velocities, along with the counterpart heart rate metrics, can go a long way. Familiar workouts with the same speed but higher effort hint at fatigue, so decide if you are pushing for deeper adaptations. Lower velocities with higher efforts can mean overreaching. Chronic poor velocities and inability to bring about effort could reflect overtraining.

Kick Velocity and Upper-body Contributions in Sprint Freestyle

An article by Hall of Famer Gary Hall Sr. about baseline kicking speed and swimming performance captivated me. Since Olympic champions Alex Popov and Michael Phelps can kick 27 seconds or faster in 50m, the anatomical and genetic gifts that make superior kicking are interesting. Underwater kicking is faster than above-water swimming on average—hence the rule change—but the relative contributions of the upper body and lower body are somewhat murky.

Many theories and ideas have been expressed with regards to improving kicking, but time and talent represent most of the equation. Some changes are possible with ankle range going beyond 90 degrees of plantar flexion, but I don’t know any good clinical studies that discuss whether manipulating this joint is good or bad in the long run. The USOC has a lot of this information, and a great resource is Dr. Nabhan who is arguably a secret weapon in Olympic sport. Some areas of the body, like the knee, don’t change from any intervention period, but all of this is still early.

A good protocol is to test kicking speed in a long course since the push off from walls taints the scores. This test should gauge how swimmers are improving. If they don’t improve kicking velocity over a career, how are they getting better? If you don’t know absolute kicking metrics, why are we focused on volume as a way to improve faster velocities? Upper-body power and the resulting speed should be manifest with adding speed to a great kick. Some athletes have had average kicks and amazing performances, but the requirements in the upper body can contribute to added speed only to a point. Both qualities are necessary to reach ultimate performance and the research isn’t very conclusive on how the great ones put every thing together.

The raw upper-body contribution can be calculated by getting the entire swim speed and seeing the contribution, and getting basic weight performances. I have seen a variety of swimming devices attempt to get power, but speed is the ultimate goal and getting meters per second on both kicking, and total body swimming is far more valid. Swimming needs to add resistance (drag, not weight room training) to get more propulsion. It’s a Catch-22. Upper-body mechanics has been always an educated guess of why things work and why things don’t change, and much of the science is hard to measure without some heavy math. The solution is measuring what can be done in practice and creating models by looking at all of contributing variables and structuring metrics that should be feeding higher speeds.

Merging Velocity Training and Conventional Interval Training

1080 Sprint at Pool Side

Figure 4. 1080 Sprint with 90 meter cable attached to swimmer.

Jumping away from the traditional approach of distances and rest periods is not going to happen, and isn’t necessary. Velocity metrics adds granularity and clarity, meaning the data is more detailed and more insightful. Someone able to complete 20x100m on a typical send-off is helpful, as it’s likely the entire lane can do the session, but it’s better to know how they are making the interval. An athlete making an honest effort and pushing hard may start out fast and slow down during each send-off. An athlete may game the interval and go just fast enough to get a 5-second rest. What is important is that coaches get velocities and time intervals since small changes in speed are hard to eyeball, and intervals are going to be able to tease out the information requested.

A good perspective is to look at year-versus-career on core metrics like kick velocity, maximal short speed velocity, decay rates, and recovery indices. I have already explained kicking speed and maximal race speeds so I will get into the decay of speed, pacing, recovery, and adaption.

Managing Velocity and Decay Rates

Stamina is a little vague, as most people think about the duration of work versus conservation of speed. Most endurance athletes can’t achieve sprint speeds because they are not designed genetically to do so. Their training isn’t about achieving maximal speed, but maximal mean velocity instead. While strategy with a kick at the end is pacing and racing, endurance events involve a conditioning strategy. Even the 50m requires conditioning, so every event needs to conserve a percentage of someone’s speed.

An example in track is the 400m and mile (1600m for convenience). An athlete who runs 50 point-something in the 400 and holds 85% speed for four laps is much more interesting than one who runs 49.5 and holds 80%. Holding 95% of 60 seconds isn’t helpful unless you are trying to run for hours. Swimming works similarly. How fast can someone swim and how much speed can they hold, based on longer distances?

What makes this more complicated is the obvious need to know how much resources are being put into getting faster presently and in the long run, and how much into holding the existing velocity. Using velocity concepts is a management of decay and trying to find a combination that works both acutely and in the long run. Several past endurance swimmers had lousy strokes because they could get away with their superior fitness. Sloppy mechanics is nearly obsolete now because everyone has the ability for maximal conditioning.

Getting Started Means Getting Measured and Profiled

Coaches need to dive in and test one athlete with the 1080 Sprint before moving toward the entire team. Adding a few hours a year in number-crunching means the difference between making the finals versus being on the podium. I have used this approach in sprinting on land with similar success. Every athlete has improved by being aware of what matters: improving velocity.

Please share so others may benefit.

Author information

Carl Valle

Carl Valle

Track and Field Coach at Spikes Only

Coach Valle has coached Track and Field at every level, from high school to the Olympic level in the sprints and hurdles. He has had the privilege of working with great athletes that have been All-American and school record holders. A technology professional, Coach Valle has expertise in performance data as well as an understanding for practical application of equipment and software. Carl is currently the lead sport technologist for SpikesOnly.com, and focuses his time on testing elite athletes and using technology to help everyone on any level of human performance reach their goals.

The post How Velocity-Based Training Improves Swimming Performance appeared first on Freelap USA.

Beyond Bar Speed Part 2: VBT Considerations and a Case for Propulsion Metrics

$
0
0

Barbell

By Carl Valle

Editor’s Note: This is part of a series of articles showing how deeper metrics of bar tracking technology can improve the quality of training in the weight room.

We have witnessed more investment into bar tracking technology during the past two years than the previous two decades. While this may seem like progress, many coaches have not progressed with the technology. Investing into bar tracking comes with a cost beyond the financial side. It requires coaches education and appreciating what the technologies are trying to do. Coaches who jump on the bandwagon to be relevant will be frustrated because they have not prepared their athletes to be aware of the importance of simply following directions and the difficulty of getting measurements on things as complex as weight training, jumping, and throwing.

As a coach, you should consider the following three questions before proceeding with adopting any VBT technology.

  • Do you have a training environment in which athletes follow directions in your training environment, respect the training process, and pay attention to it? Any technology requires that everyone take at least some measure of responsibility for it to work well.
  • If the information or data isn’t what you want to hear, will you make adjustments or continue doing what you like doing?
  • Do you have a clear plan or a realistic goal for implementing barbell tracking technology, or do you feel pressured to adopt it to keep up with the data or technology arms race?

These questions are honest ones, so by all means step right ahead if you are confident that barbell tracking will add value to what you are doing. If you are new to VBT or want to take things to the next level, we will dive into the realities of what is required to work maturely with the technology and methodology.

Measuring mean velocity or peak velocity alone has great value, but if you want to truly gauge barbell performance, you must look at all the numbers to draw better conclusions. Treat each data point like a dot of paint in an Impressionist painting—the more dots, the better the image. In this article, I will review what we have learned from Rate of Force Development (RFD), introduce Mean Propulsive Velocity (MPV), and highlight other common measures of bar tracking to fine-tune workouts for a better transfer. The heart and soul of this article are not just zooming into bar performance, but also stepping back and focusing on the big picture: how barbell performance helps with on-field performance. In sports performance, transfer is king.

Strength coaches have valued bar speed measurements for decades. Now it’s appropriate to see how biofeedback and analysis work together to get better results. The next evolution is understanding how weight training transfers with more concrete numbers, not just past dogma and current fads. Bar speed is an excellent dipstick to test what is going on in the athlete’s muscular engine, and now it’s time to maximize the human machine.

Connecting Bar Speed with Body and Bar Speed—Paydirt

Over a year ago I strongly advocated that the purpose of barbell speed with Velocity Based Training (VBT) was improving ball and body speed. Strength coaches use barbell indices to improve how fast an athlete can displace (locomotion) or how powerfully they can propel balls, competitors, and other implements. Even the Olympics and powerlifting care about the weight outcome, not bar speed, and VBT is a way to help get higher success rates. Coaches and athletes are pursuing propulsion to perform better. Sport success is based on having leg and (at times) upper extremity power to propel a body mass or another mass (large or small) faster or with a higher force. Weight training is a major player in developing this propulsive quality, and the refinement of weight training programming (enter VBT) continues to offer us small yet valuable gains.

A word of caution here. Overreliance on weight lifting as a solution can create problems. While weight training is a great way to gain confidence and create discipline, it’s mainly used to solve three needs and not much else: reduce injuries, get larger, and produce more specific force. Currently, coaches create a lot of misdirection on small nuances like “stimulating” or “potentiation.”

These are fine additions, but without raw strength and power, the athlete misses the primary reasons to lift. The goal when a coach commits to using VBT is to create small and targeted gains that show up outside the weight room. Countless coaches have successfully improved squat and clean numbers in the weight room, but fewer have proven the transference toward improved on-field performance or injury reduction. General weight numbers or data create a case for possible transfer; better numbers seal the deal.

The influx of “evidence-based programs” and various technology measurement options have created a bit of a conflict to training balance. Coaches must be careful not simply to chase numbers. The solution is to understand how and when to use those numbers and make sure they are related to the performance goal. Abstract and sometimes inappropriately positioned sport science may not help a team, and a coach without access to good research is equally ineffective. Instead of seeing science and art as oppositional, why not make the discussion a healthy perspective of how they work collectively?

The good news is the strength game is getting easier to measure and support. With more affordable measurement tools now on the market, you do not need to be a high-profile program to afford the technology to make more informed decisions. In fact, we see that affordable products do the same job (in some cases maybe even better) as more expensive and cost-prohibitive options. Since the conversation is shifting beyond concentric peak and average, coaches fresh to the analytics side may offer an improved approach to outcomes versus those who are static on legacy “norms” from the technology they have used for ten or more years.

Practical Sport Science Is Now Part of the War Room, Not the Ivory Tower

Coaches of any good strength program run solid training sessions while their athletes reflect the results of that training. As more programs transition into information-based training, there will be a phase of frustration resulting from the extra time and technical difficulties in making this adjustment. You need to understand the change (performance improvements) you are seeking when you purchase measurement tools will to some extent disrupt your daily workflow. You cannot expect the tools to fit perfectly into how you like to do things. There is a balance of what you are getting and the adjustments you need to consider to use it effectively.

Since sport science is now part of the war room, coaches are in the trenches making more informed training decisions. Being in the trenches is indeed a cliché, and the image is vivid for pointing out the very real need for something to withstand the challenge of working with a lot of bodies under pressure and time limitations. Coaches need to use every minute properly, and fumbling around with electronics is not something they can afford to do. However, planning is the best way to use time effectively in the long run, as the right direction or strategy maximizes the tactical time. The war room and trenches are complementary, not oppositional if correctly done. Two simple mantras make sense when coaches want to make VBT fit both during training and planning workouts.

  • Instant feedback adjusts a good workout plan if needed, but the magnitude is less as coaches increase their experience. Constant adjusting and reaction to planned workouts are a sign of poor program design and analysis.
  • Repeated testing of key tests and training exercises shows a cause and effect to the plan over time. As the training data increases, a training program can predict and model better workouts in advance with fewer adjustments.

A simple summary is that as the plan improves, the need for adjustments decrease. But anyone who studies the economy and chaos theory understands that perfect prediction is an illusion. All one can hope truly to get from VBT is higher precision in training and moving the needle by making fewer mistakes.

What Most Articles Miss with Barbell Performance

Barbell Performance

Figure 1. Lighter loads have decelerating phases, but most maximal strength and power programs do not have to worry about them.

My friend Bryan Mann has helped our profession understand the value of VBT. But for every smart guy like Bryan, we have some less-than-brilliant minds sharing their opinions. In several roundtable-like interviews, some of the thought leaders share some great advice here and here, but my concern is that it takes a few more reviews before coaches fully grasp the concept. Summing up this article, this is a fair conclusion: Coaches are looking to evaluate barbell performance as a way to acutely gauge athletes and indirectly help improvement to the sport the athlete participates in.

Most articles that beat around the bush simply describe what is happening at one point in time with a barbell, something that goes directly with the Impressionist painting analogy. To put it bluntly, most approaches to barbell tracking skim the surface and don’t hammer out what can be fully extracted. Perhaps a better way to explain comprehensive VBT is the idea that the numbers on the barbell plates are not the only numbers happening while lifting

Why We Need to Think Propulsion Instead of Just Bar Velocity

Mean and peak velocity are either slivers of time or artificial summaries of the time the bar is moving. The mean is a rough summary of the barbell stoke. Peak provides a narrow snapshot. While valuable, it is flawed without context. Looking at either one is great for adjusting loads and demanding efforts live, but after the workout is done coaches need more analysis to understand fully what happened.

Athletes either create propulsion (including starting RFD considerations) to project their own body or to propel another body (heavy) or object (lighter). Barbell information can show success later by relating to the athlete’s size and the demands of his/her sport. One can’t simply look at relative and absolute numbers anymore, as sports are becoming more and more competitive. Dissecting the repetition to more data points is valuable and worth the time.

These three simple examples should be familiar in any strength and conditioning setting.

  • Body stature considerations – Peak velocity for a tall offensive lineman is much different than for a shorter and stockier defensive tackle. For example, Jonathan Ogden at a looming 6-9 has more time to produce a peak velocity as his limbs are long. Anthony “Booger” McFarland is reportedly 6 feet even, thus has less time to work with but likely has a great mechanical advantage for RFD. In view of their respective roles on the field, coaches want to preserve what makes them special and not expect everyone to have the same barbell performances.
  • Load considerations – The 225-pound bench press for reps in the NFL may be outdated, but athletes are still expected to show up and perform. Because athletes are likely to score double digits, mean propulsion velocity matters because much of the rep is braking. With more maximal strength movements, mean velocity is just as valuable because maximal strength lifts are so slow throughout the repetition.
  • Technique considerations – In my article about Barbell Displacement, I outlined how fundamental and sometimes advanced metrics can polish a great strength and conditioning program. Teaching someone full range or analyzing smaller ranges (competitive-style weightlifting versus power options) is a starting point, not a nice-to-have feature. A simple change in stance or grip can mislead progress or falsely show regression, so displacement adds perspective to peak and mean values.

More examples exist, but the point of the propulsion angle is to think about how athletes create forces with their bodies, style of technique, and use of time and space. RFD and peak velocity are likely the two best starting metrics while the mean velocity family and distance of the exercise connect the dots.

Does Mean Propulsive Velocity Deserve Discussion?

Unfortunately, most coaches are unaware of how both mean velocity and mean propulsive velocity are measured and why it’s important to know. If you are serious about weight training and utilizing VBT approaches, you need to know how mean and peak velocities are measured and why they are valuable. Some authors have questioned the value of peak power and force, but output is important in quantifying work done. Remember:

  • MPV cuts out the deceleration or braking phase from light-speed lifts, a part that can distort the performance measurement of some lifts.
  • MPV can be a part of both ballistic or non-ballistic exercises, but provide the most benefit to light strength exercises where nobody or bar projection takes place. When the load is heavier with strength exercises, mean velocity is still relevant.
  • MPV is a great complement to specific RFD measurements if interpreted with great care.* MPV is also a great term to use while talking about barbell tracking because only the concentric action of the lift is measured and vividly illustrates how the measurement is taken.

* RFD is a general term describing the production of force from the first effort to peak muscular effort, and it is a wide territory for analysis. The time frames and how they are assessed are extremely important. RFD is a strong factor in performance but like any individual metric, the entire picture is needed for comprehensive evaluation.

How Mean Velocity and MPV Are Measured Scientifically

Barbell Wattage

Figure 2. Coaches should look at wattage for power and spot check the velocities to ensure the exercises are done with the appropriate bar speed.

At first glance, it’s convenient to reduce an exercise to concentric or eccentric phases. The summary one sees in some texts of a weight picked up and dropped, pushed and lowered, is okay for explaining to the layperson what happens, but not enough to help athletes. Exercises have similarities and general commonalities, as well as unique differences. Most devices that measure barbell performance will record the concentric and eccentric motion, but the primary scores displayed are the concentric output only.

A velocity score on a tablet or smartphone shows a summary (average) or single (peak) velocity measurement. The problem with mean or average scores is that the sample range could include numbers that mislead or poorly represent what the user wants to know.

Concentric phases of strength lifts include a period of technique that doesn’t represent propulsive force—simply finishing the rep—and that is braking or decelerating. Mean propulsive velocity responsibly cleaves the deceleration component in strength exercises that is subject to possible technique discrepancies. By focusing on force production, coaches know what neuromuscular adaptations are happening versus what small nuances could be blinding the training scores. The researchers from Spain looked at light loads and found that Mean Propulsive Velocity has value with some instances, but the future will be still focused on minimum values as well as peak velocities.

In summary, the findings of the present study show the importance of referring the mean mechanical values to the propulsive phase of a lift rather than to the whole concentric portion of the movement, especially when assessing strength and muscle power using light and medium loads. We advocate for the preferential use of mean propulsive parameters since they seem to be a better indicative of an individual’s true neuromuscular potential. (Sanchez-Medina et al.)

The Spanish studies usually showcase higher rep ranges and this is why MPV is great for light or medium loads, but the study on strength assessment and the propulsive phase explains the pattern of how braking becomes less involved with heavier loads. Looking at MPV with high repetition strength exercises (10 reps or higher) is very limited, but could be something used with jump squats according to Loturco and colleagues.

Since jump squats technically require one’s entire body mass (including weight) to be displaced in the air, takeoff velocity and peak velocity can be confused. I have not seen how using an optimum power load is superior to a comprehensive program that holistically increases maximum strength and RFD concurrently, but the study authors make an interesting suggestion. Perhaps the newer metrics are not the end game in VBT but rather a hint that we still have a lot to explore and should measure as much as sanely possible to uncover what is driving what in sport performance.

Juggling Multiple Variables for Full Analysis of Barbell Performance

Bryan Mann’s book on VBT (Elitefts.com) outlines velocities of successive zones to create guidance within those zones. Mean and peak velocity are the two pillars to American coaches in general because of the Tendo system. But those are training metrics, not planning numbers. The purpose of the article was to ensure that the workouts performed meet the expectations of the exercises, not replace designing a good workout program.

Force, power, velocity, and even displacement are extremely useful variables but most coaches are familiar with the speed zones, and that is fine. If athletes perform the exercises in the vicinity of the intended velocities, the training plan has a chance. Force and power—be they peak or mean—have less connection to coaches because most relate to total weight on the bar, and speeds ranging from .3 to 2.2 meters per second. Coaches know when the weight is heavy, and athletes are battling in a squat, and when athletes are snatching fast when the reading is above 2.0 or similar. Barbell speed tracking is comfortable, but bar velocity is very much in exile unless the coach has other contextual numbers.

Here are some takeaway suggestions I have struggled with so you don’t have to waste time:

  • Measure body composition as much as possible. Strength and any other ratios to bodyweight are never as valuable as getting the contributions of lean mass as well. Two 75-kilo athletes may perform similarly but succeed much differently. I like the direction of the concept of bodyweight percentage that Sparta shared in the article from Bryce, but they are only the middle point. Many athletes can squat 2 times bodyweight or snatch their bodyweight, but no magic coefficient shows up to explain why some outperform others with speed and jumping.
  • Never isolate power numbers if conditioning matters in your sport. So many athletes look great in combine testing but for some reason struggle when aerobic factors are mixed in. Don’t compromise too much and learn how to balance both so performance is maximized on both ends. Conditioning or displacement rates in field tests should be combined with body mass and stature measurements. It’s fine to test speed and power separately, but watch how power fluctuates when practice and/or conditioning are added.
  • Most coaches ignore power and force metrics, but it’s important to add those scores to the database of training records. Peak and mean values add more landmarks to what is going on, especially when the lift displacements are accurate. Instead of tossing the numbers out, watch how they trend over time. RFD, time to peak, and other metrics will give immediate and long-term guidance if analyzed and interpreted correctly.
  • Again, make sure to perform speed and other field tests. If you have more weight training metrics than speed metrics, rethink the purpose of your training. I am amazed how many coaches will inventory massive lists of barbell outputs but barely hand-time sprints—if at all. I suggest making sure you record other field tests in jump performances with vertical and horizontal movements. The wider the range of tests, the less likely bias or style will hurt your program. Most coaches with distinct styles who showcase their programs are least likely to succeed because they should be reflecting athlete needs. If a colleague can read your workouts and easily see your fingerprints, it’s likely you are lost internally with a philosophy rather than what your athletes are showing physically.

Suggested Reading

If you don’t own Paavo Komi’s classic Strength and Power in Sport, I highly recommend getting it. Other texts such as Strength and Conditioning: Biological Principles and Practical Applications and Neuromechanics of Human Movement are gold as well.

Please share so others may benefit.

Author information

Carl Valle

Carl Valle

Track and Field Coach at Spikes Only

Coach Valle has coached Track and Field at every level, from high school to the Olympic level in the sprints and hurdles. He has had the privilege of working with great athletes that have been All-American and school record holders. A technology professional, Coach Valle has expertise in performance data as well as an understanding for practical application of equipment and software. Carl is currently the lead sport technologist for SpikesOnly.com, and focuses his time on testing elite athletes and using technology to help everyone on any level of human performance reach their goals.

The post Beyond Bar Speed Part 2: VBT Considerations and a Case for Propulsion Metrics appeared first on Freelap USA.

Record, Rank & Publish: 8 Weeks of Alactic Training

$
0
0

Phosphate Muscle Energy

By Tony Holler

The alactic anaerobic system is the dominant source of muscle energy for high-intensity explosive exercise that lasts for 10 seconds or less. I refer to alactic training as “phosphate training” because the fuel for this first 10 seconds of high-intensity explosive exercise is the ATP (Adenosine Triphosphate) which is readily available in muscles.

The lactic anaerobic system (glycolysis) is recruited after the ATP storage has been depleted (usually after ten seconds in well-trained athletes). We do “lactate workouts” once or twice a week starting February 8th. And, meets are considered lactate workouts.

Over the winter, I believe sprinters should develop a speed base, not an endurance base. We never do lactate workouts or aerobic workouts in the winter. We only do phosphate training (alactic). All training is high intensity for periods of less than ten seconds.

I share what we do for the benefit of others. We do what we do because it works for us.

At Plainfield North High School, we train after school from early December until early February. Our school day goes from 7:05 until 2:10, so we start at 2:30. The workout goes from 2:30 until approximately 4:15.

This year, 130 boys participated in our program at one time or another. The average attendance was typically 80 to 100. The program is non-mandatory and unfunded. I’m the head track coach and freshmen football coach at North. I run the sprint part of the workout. Our football coach, Tim Kane, manages the weight room activities. We’ve done this for ten years without pay, working together for our mutual benefit and the benefit of Plainfield North athletes. Everyone wins.

Tim and I don’t always agree, but we always find common ground. I am often asked how to change the mindset of a football coach. The stereotypical football coach is a paranoid, testosterone-riddled, hard-headed, Type-A personality who measures his life in first downs and turnovers. Transforming the mindset of a football coach is not an easy task.

No driven man hears unwanted counsel. – Janny Wurts

Most head track coaches come from the cross country universe, making the unification of track and football programs nearly impossible. I’m thankful that Coach Kane sees me as a colleague, not an alien. The fact I’ve won 39 consecutive games as his freshmen football coach gives me some street cred.

Distance Runners Build an Aerobic Base

For the distance coaches out there, our 40 distance runners run outside every day in rain, sleet, snow, and ice. High winds and cold temperatures are daily. Coach Andy Derks has created a culture where no culture had previously existed. Our distance runners train aerobically with speed work mixed in. Distance coaches build an aerobic base, sprint coaches build an alactic base (unless you are a disciple of Clyde Hart).

Plainfield North Coach Derks

Figure 1. Coach Derks came to Plainfield North in 2012. Last year we had 22 guys run under 5:00 in the 1600. Our distance crew makes up about 40% of our track team. The other 60% percent of our team spend their time sprinting with me and lifting with Tim Kane.

The Winter Speed & Strength Format Nov 30 – Feb 4

In the weight room, we strength train Monday through Thursday. I have expressed my lifting philosophy to Coach Kane and he generally agrees.

Our varsity football players lift first, at 2:30. Fifty guys lift as a team. I would rather have all my sprinters in the 2:30 sprint group, but this is a compromise I make.

Coach Kane compromises too. No lifting is done on legs until Thursday. We take Friday, Saturday, and Sunday off. Some people call it a three-day weekend. I call it supercompensation.

Since the varsity football group does not include seniors who have graduated from the football program, my 2:30 sprint group will have some senior football players. In addition, I have freshmen football players, lacrosse kids, baseball players, and, of course, track athletes.

The first session lasts 45-50 minutes, and then our groups switch. From 3:20 – 4:15, I speed train the varsity football team.

On a given day, only 50% of the kids being trained are track athletes.

Winter Speed Training

We start every day with sprint drills, probably the same drills you’ve seen everywhere. As another coach once told me, “Everyone does speed drills, but your kids do them better.” I believe this to be true. We never go through the motions. I refuse to call our opening session a “warmup.” In 17 years of doing this, I’ve never had an athlete get injured doing speed drills. Never. The speed drills done every day include A-skips, high-knees, butt-kicks, 5 box jumps, bounding, straight-legged bounds x2, butt-kick & reach (retro sprints) x2, and starts (2-point, 3-point, or 4-point hop & go). We are done in about 10 minutes.

On Mondays and Wednesdays, we sprint for time. Our field house has a 180m track with a six-lane straight-a-way. We have enough room to run the 55m in an indoor meet. On Mondays and Wednesdays, our kids run 40-yard dashes with a hand-held time. I’ve been doing this for 17 years and can’t give up on my comparative data. Our times are fast because of hand-timing, 2-point starts, and wearing spikes on a rock-hard track. Here is the kicker … we time the last 10m with Freelap (Pro Coach, 12 FxChips). With every run, I record two types of data, 40-yard dash and 10m fly. We run solo. I don’t believe in racing until track season. I want sprinters focused on their fundamentals and competing against themselves. I record, rank, and publish times.

We have two groups, the non-sprint-slow-guys-who-don’t-wear-spikes group, and the speedy-always-remember-their-spikes group. Group-1 is one and done; then they leave the field house. Group-2 runs three 40s.

When coaches hear that we run only three sprints, they are dumbfounded. What? Then what do you do?

“Hard work beats talent when talent doesn’t work hard.” “Nothing worth having comes easy.” “There’s no substitute for hard work.” Coaches are addicted to quotes about work. If the mission of a coach is to get their athletes tired, fine … but don’t expect speed to improve.

Stupid coaches sometimes have the hardest practices. Focus is the key to speed, not hard work.

Work Harder

Figure 2. Don’t be this coach. Train smarter, not harder.

On Tuesdays and Thursdays, we do X-Factor workouts. On these days, the football coach joins me. Like always, we do 10 minutes of speed drills. After speed drills, we do four different activities in the form of stations, rotating back and forth between the football coach and me. The only thing I’ve asked Coach Kane … please do things at top speed then allow for enough recovery to go top speed again. The easiest thing for any coach is to get their athletes tired and sore. “Any fool can get another fool tired.” Coach Kane will do agility work, multi-directional sprinting, short hurdles, and speed ladders. X-factor is a day to try new things (“x” stands for unknown). I do wickets, hip mobility, plyometrics, lunges, depth jumps, cat jumps, etc. Since football lifts legs on Thursday, X-Factor is a good way to end the week.

Remember, our program at Plainfield North is based on common ground. Would I prefer sprinting before lifting? Of course. Do I agree with training Monday through Thursday? No. I would prefer Monday-Wednesday-Friday. I am fundamentally opposed sprinters training when they are beaten and battered. We all make deals with the devil, and I will always make deals with football coaches.

Statistics, Data, and Teaching to the Test

My data justified my training philosophy a long time ago. I’ve been doing this for 17 years, and my athletes get faster. More important, talented athletes are attracted to my sprint program.

Data drives my athletes. Low-effort never happens in my speed training. No one forgets their spikes. I literally see my sprinters carrying their spike bag with them in the hallways. Backpack, cell phone, and spikes … the necessities.

At Plainfield North football players run track:

  • 28 of our 52 sprinters are football players (54%)
  • 9 of our 13 throwers are football players (our throws coach is a varsity football coach)
  • None of our 40 distance runners played football last fall
  • 37 of our 105 track athletes play football

Plainfield North opened its doors in 2005-06 to only freshmen and sophomores. I became the first head track coach at North in 2006-07. Our first senior class graduated in 2008.

The graph below illustrates our ten-year progress towards creating a culture of speed. I brashly tell people that athletes at Plainfield North know their AFT (Average Forty Time) better than their GPA.

Sub 4.6 40-yard dash

Figure 3. Number of athletes that ran sub 4.60 in the 40-yard dash by year.

Oddly enough, we qualified for the state 4×100 in 2007 in spite our overall lack of speed. It only takes four reasonably fast kids with great handoffs to run a decent sprint relay. If you question our impressive speed numbers, remember … we run hand-held 40’s with a 2-point stance with spikes on a hard track. The numbers are legit. If you time your 40s outside on turf without spikes wearing sweat pants and hoodies, your times won’t be as fast. Personally, I like fast.

In addition, the 40s timed in our winter workouts are always done in the same lane and same direction. Wind is never a factor because we run indoors. I’m the only person who times 40s. No manager or assistant coach will be trusted with the stopwatch.

Why Record, Rank, and Publish?

It’s difficult for some people to understand why we post sprint times. The haters of the world will think we are being boastful. This could not be further from the truth. We simply post times to make times meaningful. Athletes crave competition. Athletes are starved for praise. In addition, coaches must demand quality.

Try this sometime. Tell an 8-year-old to run as fast as he can between two Freelap transmitters (yellow cones). Tell him his time. Then tell him that you will give him $10 if he can run faster. Have several kids cheer him on from both sides of his running lane (we call this “the gantlet”). I am 100% certain you will lose $10.

I did this once in speed camp. I had a young boy who ran several times above 2.00 in the 10m fly. Each time I encouraged him to SPRINT, but his times remained slow. When I attached meaning and significance to his sprinting, he ran faster. His best time improved from 2.03 to 1.57. When you record, rank, and publish, kids learn to SPRINT. Otherwise, kids just run.

Attracting Athletes to Track & Field

Good track programs attract athletes. 24 of my 52 sprinters are newcomers. Check out the average 40 time and average 10m fly time for my top 11 newcomers.

  • Wallace Thomas, sophomore, no other sports, first-time track athlete, 4.35, 1.05
  • Kevin Block, junior, football, baseball defector, 4.44, 1.05
  • Ezra Docks, sophomore, football, moved in this year, 4.51, 1.07
  • Nick Wood, sophomore, football, volleyball defector, 4.51, 1.07
  • Jaylen Watkins, sophomore, football, didn’t do a spring sport last year, 4.62, 1.10
  • Angel Guevara, sophomore, didn’t do spring a sport last year, 4.63, 1.09
  • Anthony Capezio, freshmen, football, 4.59, 1.08
  • J.D. Ekowa, senior, football star quarterback, 4.65, 1.08
  • Burhan Cutlerywala, freshmen, 4.72, 1.08
  • Shane McGrail, sophomore, football, baseball defector, 4.68, 1.08
  • Zach Nadle, sophomore, football, baseball defector, 4.78, 1.12

When you add eleven guys like this to a good track team, the future looks bright. Kids love a speed-based track program.

Returning Sprinters

We’ve had some bad luck with three of our top sprinters. Tim Donnahue was expected to take one of our sprint relay spots but broke his leg in Wrestling. Our two returning all-state athletes have had some senior bad luck as well. One has a hip-flexor injury and hasn’t sprinted since football. The other, our two-time MVP, has struggled on a daily basis to find food, transportation, and shelter. No one said it would be easy.

Relay Handoff

Figure 4. We return Zach Shelton (left) and DeVaughn Hrobowski (right) from our all-state sprint relay teams. This picture was taken at Sectional when we ran 42.07 in spite of this run-up handoff at the first exchange. Shelton and Hrobowski missed our winter training. Shelton was injured, Hrobowski spent the winter on the wrestling team.

Despite the bumps in the road, we have seen great improvement in most of our core sprinters. The numbers below indicate their average times last year compared to their average times this year.

  • Carlos Baggett, junior, football, 4.46 to 4.28, 1.04 to 0.98
  • Clay Pasen, senior, lacrosse, 4.50 to 4.40, 1.03 to 0.99
  • Tyler Hoosman, junior, football, 4.66 to 4.42, 1.12 to 1.03
  • Cory Hrobowski, senior, no other sport, 4.62 to 4.44, 1.07 to 1.03
  • Kevin Block, junior, football, 4.65 to 4.44, 1.09 to 1.05
  • Joe Stiffend, sophomore, football, 4.60 to 4.45, 1.04 to 1.01
  • Jordan Gumila, junior, football, 4.57 to 4.46, 1.07 to 1.04
  • Brian Registe, sophomore, football, 4.48 to 4.46, 1.04 to 1.04
  • Hunter Houslet, senior, soccer, 4.71 to 4.51, 1.06 to 1.02

2015 Compared to 2016

The numbers also point out that we are an improved sprint group, at least in sprint depth.

  • Last year’s average 40-time of our 25 fastest sprinters was 4.51. This year 4.42
  • Last year’s average 10-fly time of our 25 fastest sprinters was 1.05. This year 1.01
  • Last year we had five athletes averaging sub-4.50 in the 40. This year we had 13.
  • Last year we had 15 athletes averaging under 1.08 in the 10m fly. This year we had 25.

What it Takes to Make Our Sprint Team

We have tryouts for three weeks (Jan 19 – Feb 4). This is what it took to make our sprint group (slowest sprinter from each class, average 40-time and average 10-fly time):

  • Freshmen 5.08 and 1.19 (football player and high jumper)
  • Sophomore 5.12 and 1.18 (5’10” high jumper as a freshman, scissor-kicked 5’8” last weekend)
  • Junior 4.90 and 1.13 (220-pound star linebacker, first year of track)
  • Senior 4.78 and 1.11 (football player and hurdler, last year’s times 5.04 and 1.19)

Celebrating Improvement

Data allows us to highlight athletes who show incredible improvement. Celebrating these athletes, in turn, promotes track & field.

Tyler Hoosman is pictured below as a freshman B-team running back. Tyler went out for track his freshman year despite being our slowest sprinter. As a freshmen, Tyler ran the 100 in 13.00, the 200 in 27.9 and long jumped 16’8”. As a sophomore, Tyler obliterated those numbers running 11.92 and 24.38 while long jumping 19’10”. It doesn’t take a rocket scientist to project amazing things this spring. Oh, and by the way, Tyler was our varsity’s leading rusher in his junior season. He returns next year.

Running Back Tyler Hoosman

Figure 5. Plainfield North Running Back Tyler Hoosman as a freshman.

Tyler Hoosman no longer looks like a B-team freshman running back. Tyler now looks like a sprinter. Not everyone will experience the incredible improvement of Tyler Hoosman, but if you don’t measure speed, you will never know.

Running Back Tyler Hoosman

Figure 6. Tyler Hoosman as a junior. Next year Tyler will dominate.

Run fast to get fast.

Train the alactic system (100% intensity, less than 10 seconds in duration).

Train smarter, not harder.

Recruit, Promote, Attract.

Record, Rank, Publish.

It works for us.

Please share so others may benefit.

Author information

Tony Holler

Tony Holler

Tony Holler is a teacher and coach at Plainfield North High School. Holler has 35 years experience coaching football, basketball, and track. Holler is a member of Illinois Track & Field Hall of Fame and Co-director of Football-Track Activation Consortium along with Chris Korfist.

The post Record, Rank & Publish: 8 Weeks of Alactic Training appeared first on Freelap USA.

Learning From Everywhere

$
0
0

ALTIS Elite Athlete & Coach Training Environment web link

Dan Pfaff massages athlete

By Ryan McNamara, 5or6

Over the last few years, I have been in the fortunate position to work with some of the best coaches, therapists, and athletes in the world at ALTIS.

I’m not gonna lie; it’s been fun.

At ALTIS, I deal with all things website related, and I love it. I’m not a coach, and presumably will never be one, yet that doesn’t mean that I can’t pick up a thing or two from everyone there. If you can’t learn from someone who is the best in their field, from who can you learn?

When I started at the center three or so years ago, it was small. There were only a handful of athletes and even few coaches. Yet the center has exploded over the last three years to over 140+ athletes, coaches, and therapists. It’s been a bit of a whirlwind and so much has changed, yet the core beliefs haven’t shifted an inch. The shared culture is intoxicating, and the willingness to help everyone is the main reason I love working there. Plus it turns out if you get to watch the likes of Dan, Stu, and Andreas coach, teach and interact for three plus years you pick up a few things. Who’da thunk it!?!

Become a Student and a Teacher

One thing I immediately picked up was the need to share what you know and listen to what others have to say. That last bit can be harder than it sounds.

I write and try to share my (limited) knowledge within the web and design industry but watching the coaches at ALTIS they view sharing knowledge on their craft as a cornerstone to furthering their learning on the subject. They understand that they don’t have all the answers and that no one does. However, they have surrounded themselves with brilliant individuals from all over the world who can open their eyes to new ideas and theories that can enhance every athlete, coach and therapist around them.

In an article on A List Apart by Jeffery Zeldman (the Godfather of web standards) he translates his thoughts on why he began his blog and what it has brought him in his 15 years online, and it struck a chord with me. Documenting and articulating your ideas and processes helps your communication methods and provides an outlet and base for your knowledge to grow, plus gives others a chance to interact with you.

Fortunately, the web (in my eyes) is certainly one of the most open industries. The likes of Trent Walton, Jeremy Keith, and Scott Jehl are constantly making me feel more than stupid on an almost daily basis, but in doing so renewing my faith in the importance of sharing knowledge.

Keep it Simple, Stupid

I remember talking to Dan one evening while tucking into a plate of ribs and him commenting to me that “training is like medicine,” you don’t want to overdose on it.

Doing so can have some pretty severe repercussions for the athlete and coach. After all, athletes can’t earn a living injured. Yet so many overtrain to gain an ‘edge’, when what they should be asking themselves “What is the minimum effective dose?”

Light bulb moment

On the web, this method also applies. Reducing clutter, providing focus, and creating a clear structure for users is the goal. Doing this is the most effective way to deliver content to users and a return of investment for the clients. I’m always aiming to give the user the best experience on the site without compromising on their end goal.

ALTIS Coach Stuart McMillan

Why add noise when sometimes silence can add clarity?

You have to Understand the Numbers

At ALTIS, every athlete is expected to document their training progress. This means notes on track sessions, gym workouts, and even sleep patterns.

The information is then used to determine where each athlete is during training blocks and how they have progressed month on month and year on year. Pretty smart right?

Documenting progress allows the athlete and their coach to measure what is working and more importantly, what isn’t.

On the web if you don’t have a grip on the numbers how can you add context to your project? If you don’t know what you have done in the past, how can you plan to go forward?

Monitoring progress through analytical tools can be ongoing. However, this allows me to make informed design decisions when I’m developing web projects. Understanding the stats gives me a greater base to understand what is happening on the website.

Set Goals

Every athlete and coach have a clear set of goals in front of them, something they want to achieve short and long term. Some of the goals might be realistic, and some might not be. Knowing them can help define the training blocks, rest periods and competition schedule for the year.

If you are building a site to achieve something (you most likely are), then the project goals should pave the way for everything that comes after.

Research creates a better understanding of how you are going to achieve the sites goals. Like on the track if you don’t know what you want on the web, and you don’t talk to the client, there is a pretty good chance things could go pretty wrong.

Like most of the topics I have highlighted, having goals allows you to sift through the crap and highlight what is important.

Whatever your job title, level of experience, or position in your organization I hope this helps show you can pick up tips and tricks from anywhere and apply it to your own work. Don’t be afraid to ask questions and test your ideas because you know what, they might just work.

Ryan @ryanfmc @5or6

Please share so others may benefit.

Author information

Ryan McNamara

Ryan McNamara

The post Learning From Everywhere appeared first on Freelap USA.

Viewing all 211 articles
Browse latest View live


Latest Images