Quantcast
Channel: Freelap USA
Viewing all 211 articles
Browse latest View live

By Leaps and Bounds: My Evolution to the Split Jump

$
0
0


Split Jump

By Ken Jakalski

In 1975, the first school where I taught ordered a Leaper machine. An isokinetic trainer, the device was the brainchild of legendary swim coach James “Doc” Councilman and Mini-Gym president Glen Henson. They saw it as a breakthrough in the sports equipment industry. It allowed athletes to do any number of reps at max effort because the machine adjusted with every rep as athletes became fatigued.

Leaper

The Leaper. Note the 70s-style shorts and socks in this image!


Many people heralded the Leaper for its ability to help athletes make big gains in their vertical jump. Indiana basketball star Kent Benson claimed that, after a summer’s work on the Leaper, his vertical jump improved by 4 to 6 inches. He led Indiana to the 1976 NCAA basketball title, which helped the marketing. So did several newspaper articles and even a Sports Illustrated feature on athletes benefiting from the new technology. The company sold over ten thousand Leapers in the 1970s and 1980s. NASA even launched a Leaper into space to help Skylab astronauts maintain their strength in zero gravity.

An Expensive Clothing Rack

My experience with the Leaper (which, in homage to jackrabbits, I nicknamed the Lepus) was different. My athletes hated it. After using it for a month, they draped their warmup jackets and pants on it. Despite the hype, why didn’t they like the Leaper?

For one thing, there was nothing “tangible” indicating strength gains. Athletes would watch a manual dial. The faster they applied force, the higher up the dial moved. This seemed to be an immediate turn-off. As I think about this now, the best explanation may be in one of the many great lines Carl Valle has presented on issues related to analysis and feedback: “Imagine if we painted over the numbers on weight plates and only eyeballed vertical jumps. Most coaches would cry heresy or think one is crazy.”

Perhaps my athletes chose to use the Leaper as a clothing rack for the same reasons. The only way they could gauge their progress was by way of that force dial, which was cheap and clunky-looking even by 1970s standards. Henson himself was not satisfied with mechanical assessment monitor on those early units. Current models now have LCDs that count reps, measure power output and work in foot-pounds, and provide an average work number for all reps done—all good things. And other current products, such the 1080 Quantum Robotic System discussed in a previous blog, that provide meaningful data while continually challenging athletes to achieve higher levels of force, power, and speed.

My Leaper experience became the first of many “epiphany moments” during my track and field career. It pointed out to me the importance of creating the kind of progressively demanding training activities that provide valuable feedback, so athletes maintain their focus and their interest remains high.

Introducting Split Jumps

One example of this is “Split Jumps.” Originally, this in-place alternating-leg jump movement involved a couple of cones and short sections of fiberglass rods. Athletes began at a lower height—like 2 to 3 inches—and progressed to higher heights—4 to 6 inches. I drilled holes in the cones so advancing to a higher height was easy.

How do I complex that drill once athletes get bored with the initial movement?

First, I add a lateral jump component. They jump sideways, clearing one set of cones, and then go back to their original position.


Video 1. Split Jump with lateral component.

Next, I have athletes go two at a time while attempting 180s without breaking stride. The key here is to have athletes make their rotations both to the right and left. Some athletes have a natural rotational bias to turn one way. Making them go the opposite way is challenging.


Video 2. Splits Jumps with 180 complex.

I further complex the tandem jumps by bouncing, lobbing, or chest-passing a med ball to athletes. The goal is catching and firing the ball back without breaking the movement. These throwbacks involve eccentric contractions. They should be fast and explosive. Athletes should not bring the ball to their chests before releasing. This is not easy, especially when the ball is bounced or lobbed. I also fake the toss, looking at one athlete but throwing to the other. This action further forces concentration. If an athlete stops because he has broken his rhythm or disengages the rod, he could still get hit with the ball if he is not looking ahead. Athletes watching this exercise enjoy seeing a teammate get plunked.


Video 3. Splits Jumps with med ball pass.

Duration and Safety Concerns

How long do I keep them split jumping? Early in the season, until one of them breaks stride or drops mishandles a med ball. Two new athletes take their place. As they get better, I stop when they begin slowing down, which is clear from their longer ground contact times.
For safety reasons, I stopped using fiberglass rods and went with 2×4 foam blocks that are 36 inches long. Our pit reconditioner supplies these for free. The next clip shows the foam block in the horizontal position.


Video 4. Foam blocks enhance athlete safety.

I can complex the drill, either by having athletes go from the 2-inch height (horizontal) to 4-inch (vertical) or, as in this last clip, by having athletes attempt the “top-of-the-line,” a clean 360 without any break in movement. This is the most difficult way I can complex the activity. Runners like to get to this point because they know it’s hard to do. Teammates enjoy watching someone attempting a 360. They are pretty vocal when he sticks a clean one going both to the right and left without ever breaking stride. Incidentally, the athletes in these last two clips are distance runners.


Video 5. Add a 360 to the split jump without a break in movement.

What do I most like about these split jumps? For one, they can be done in limited space. We have no indoor facility. To avoid having to come back later in the evening to use the gym after basketball practices, we work out in a classroom or the high school hallways. The first three clips take place in one corner of my assistant coach’s tech lab!

Most important is that split jumps are just fun to do. They engage the athletes in various levels of complexity. Concentration and arousal are always high.

Forty years after the dawn of the Leaper, my athletes now have a few more protocols on which they can confidently hang their hats.

Reference

The Leaper: Isokinetic Resistance Exercise

Please share so others may benefit.


.

The post By Leaps and Bounds: My Evolution to the Split Jump appeared first on Freelap USA.


Why Bar Displacement Is a Hidden Gem in the Weight Room

$
0
0


Squat Rack Platform

By Carl Valle

As someone who has used every device on the market, I place my priorities on what is important, not what is exciting. The boring reality is that most problems in the weight room are not new. In this article, I will address having more success in the weight room with bar tracking technology. The GymAware system is a great option for looking at the velocity of exercises, and displacement is a lesser-known but still vital measurement we need to do better with.

We pay considerable attention to bar velocity and exercise wattage, but not enough into sharpening the basic need of doing things right versus doing them with higher speeds or forces. For example, take the need to squat deeply, based on anatomy and skill level. We need to focus on doing the key core movements better early, then refine output as athletes evolve in training.

Displacement in the weight room: what, why, who, and when

Defining displacement is difficult as it covers a lot of movements. I looked at everything I did in the last ten years and compared it to what I have been doing since I started doing more bar tracking. What seems simple—like asking how deep one squats—was an easy answer years ago, as most referred to milestones such as “below parallel” or even “90 degrees.” At first glance, this is convenient, something simple we can refer to. But when things don’t work out with the simple we have to go back to the drawing board.

Displacement is a measurement of change between different starting and stopping points in time of exercises based on a static reference landmark.

I revised this summary several times before finally accepting it. The primary rationale is that it fits every exercise and forces coaches to ask what information they want to know about their program. What I had thought was a simple measurement or metric turned into a Cambrian explosion of important data.

Why should you want displacement, to see how distance and time create forces or control them? Work can be teased out, the technique can be properly evaluated, and even safety can be enhanced with bar displacement.

Athletes doing strength and power training can benefit by recording the displacement of their barbell stroke. Athletes without barbells can benefit as well. Many youth and aged athletes use dumbbells and sandbags to create external loading after they perform unloaded motions.

The best time to look at displacement is when athletes are introduced to formal training with loading and teaching, meaning exercises that develop athleticism outside teaching specialized or game-specific movements.


Athletes doing strength and power training can benefit by recording the displacement of their barbell stroke.
Click To Tweet


What coaching or training benefits does bar displacement provide?

Now that the technical side is covered, let’s get down to business regarding what coaches want to know about the above information. I will boil down the needs to very explicit benefits with regards to bar displacement here.

Squat Depth

Objective feedback and recording: Full and appropriate ranges have always been athlete perception versus coaching observation. While the data from coaches is likely to be strong enough, it’s always a matter of the athlete knowing versus coach telling and remembering. Bar tracking helps athletes see if they are doing what they are supposed to do, without creating negative subjective feedback from a coach.

Orthopedic health and management: Sometimes a movement may need to have specific ranges of motions to be mechanically safe to soft and hard tissue structures. Each athlete has a general biomechanical path that allows for effective and safe motion.

Workload scoring and typing: Work is a product of factors like distance, load, time, and other variables. Displacement during lifts can get muscle engagement estimations based on modeling and research. Surface EMG is important to consider if you want absolute information, but legacy research should guide basic exercises and give some helpful information.

The three big needs—following directions, safe movement, and sharper calculation of work—are essential. Simple displacement opens the door to a world of possibilities for coaches, sports medicine practitioners, and athletes.

Bar Displacement in Action with Squatting

The need to do barbell squats is something many strength coaches will be interested in whether they do front, back, or split squats. To me, it’s about getting the priorities mastered and performed properly. For illustrative purposes, we will use barbell front and back squats. When coaches use depth in coaching bilateral squats, they want the COM (center of mass) to drop. Increasing the distance the pelvis travels usually makes a more positive contribution to general performance, all else being equal. Most coaches want to squat deeply, and athletes sometimes can’t do that without excessive lumbar flexion and risk to the hips. How can you assess the best range of motion? My suggestion is to use the assessment of Dr. Stuart McGill and add bar displacement metrics to monitor consistency.

Step 1: Orthopedic Assessment

Squatting depth is more than just length of the torso and leg anatomy. It’s a complex yet elegant way of expressing body movement and mobility. From a legal perspective, I prefer the integration of measurements from a PT or ATC with good training knowledge instead of doing the assessment myself. Medical professionals need to more involved with athlete health while training, not just for injuries. Screening is always a crapshoot, but if you want to load the dice a bit squat properly.

Use video and measure the end ranges to see what type and depth of squatting pattern to use with the lower extremities. Understand that things change slightly with the addition of ground reaction forces and a barbell, so make sure you can convert that information to a weight-bearing squat pattern. Some neurological and motor skill changes occur, but we are looking for limits on joint patterns rather than coordinative limits.

Strength coaches should include the following data sets in their AMS platform or spreadsheet. It takes 10 minutes per athlete, but, believe me, it pays off tenfold over years of training.

  • Pant inseam – The traditional measure of pant length
  • Foot size – The standard foot measurement with or without socks
  • Foot and tibia length – The length from below the kneecap and barefoot versus shod
  • Standing width – The distance between medial ankle points when standing
  • Squat width – The distance between medial ankle points when squatting
  • Foot flare – How much external rotation in degrees one uses to squat

The FMS (Functional Movement Screen) has taken a beating lately, but let’s be clear about the value of using unloaded exercises you plan to load. For years, I have used the overhead squat. I use that motion in addition to the traditional front and back squats to help assess how athletes respond to exercise patterns. A baseball team doesn’t try to predict UCL injury in pitchers with a squat indirectly; they try to make sure their squats are better directly! I video the exercise from the side and back and score that data in degrees with Dartfish. Then I merge the medical data with the exercise information.

Measuring Bar Displacement with GymAware

The result of all this is the safe range of motion athletes can do in a general squatting pattern (orthopedic) and what happens when they are on their feet with an exercise appraisal. In the past, I just watched carefully. But this information is instantly vertical. You get what you need to know immediately.

Step 2: Exercise Setup

In the early 2000s, I attended the SWIS and EliteFTS conference and seminar for proper squatting procedures. Jim and Dave hurt my feelings each time but were patient and added considerably to my coaching knowledge. I was never a power lifter nor had experience with Olympic-style lifts in high school and college, so I was merely competent and safe. I wanted more. I learned the importance of setting up the exercise and doing the details of respecting the exercise at all loads. Most people might think Jim and Dave cared only about heavy loads, but they made sure the expectations were high on the warmup with just a light load as well.

Their motto was “Treat heavy weights like they are light, and light weights like they are heavy.” What is important is instilling a consistent, repeatable approach to doing the exercise no matter what the load. Why? Repeatability increases the safety of the exercise and offers a better environment to assess change. If an exercise modifies stance or bar placement, the data changes and so does its interpretation. If it weren’t for those two workshops in Toronto and Boston, my current data would be tainted.

Step 3: Coaching assistance

Merging the medical and teaching screening to loaded assessment is the third and hardest step to do as it adds to the rubber hitting the road of the athletes putting it together. Having them use the range of motion they are given genetically, applying the procedure of starting and ending the exercise faithfully, and repeating the pattern with load is the goal. Coaches must reinforce and guide their athletes in the little nuances of squatting or executing the exercise.

Coaches want to see if athletes hit their motions via eyeballing the pattern and making sure it looks what is expected. Sometimes the movement may increase range, but a lot of coaching is ensuring what athletes can do is repeated over and over again.

Athletes make three classic errors when they are loaded and squatting. These errors can occur anywhere and at any level.

  • Change in lifting strategy – Looking for a better number (pounds on the bar), athletes change their technique to get a mechanical advantage. Coaches want better transfer of increased muscular work, not better numbers from changing the motion. Athletes need to remember that the goal of lifting is to improve performance, and lifting sports are about improving numbers.
  • Change in torso position – Sometimes less-skilled athletes will bend more at the torso because they perceive they are moving their center of mass lower. But they are simply bowing. Bar-tracking technology can pick up a little discrepancy, but the lack of depth doesn’t provide the same stimulus.
  • Decrease in range or change in speed – Sometimes athletes are afraid to get stuck in the hole or simply feel unsafe squatting deep when the load increases. They may fight the depth and shorten up the stroke or pop a little to cheat on technique. While work may be similar to a faster descent, athletes must show control. So I don’t like bouncing in general.

The goal of the coach is to ensure that change only occurs on the scale, not on the exercise. We want to increase weight without changing anything besides effort through the feet.

Step 4: Long-term Analysis

Long-term analysis on squatting depth and general displacement throughout the season is awesome. While I have used barbell squats as the example, it’s relevant to all exercises, not just one movement. As a fan of Tom Tellez, I use the word stroke to replace the barbell or exercise motion length or action. Here are a few examples from the community of coaches.

Relationship between exercise weight and range performance

Simple observation of one exercise and execution over time is a great lesson in strength training. Does the athlete do the same stroke over time, even when the weight increases? This is not just as simple as the distance of the stroke. Some athletes use depth as an advantage, such as bouncing off the chest in bench presses. A tiny and simple variable of motion distance and the context of the displacement is extremely valuable. Repetition tempo and sticking points based on distance are all very telling of what is happening

Relationship between program phases and performance

Another area of interest is seeing how different phases of an exercise show ranges of motion. Some exercises are concentric influenced, like pulls and shallower versions of the Olympic lifts such as power cleans. It would be interesting to see how the sum of bar displacement during each phase of the general lifting program shows up in other areas. Obviously, this type of analysis requires more time, but I find that harmony over a season means contrasting training by balancing out the scores every week or even mesocycles. Sometimes the range of motion of exercises is interesting to see with injury patterns and eccentric strength.

Relationship between anatomical factors and exercise modes

The value of seeing simple comparisons like right and left leg in reverse leg pressing or split squat asymmetries may provide evidence of bad habits or injury. Sometimes left and right asymmetries don’t lead to a finite conclusion, but knowing patterns over time do matter. Athletes may train for years, and all of the reps add up to great results. But sometimes they add up to problems if not carefully watched. One example is major differences in leg power with cross-sectional asymmetries.

Over time, some athletes may create changes in mobility and specific strength from program design of exercises, so the taxonomy of different movements in the weight room matters. I suggest seeing how structural balance distributes the work properly and reduces pattern overload.

Putting bar tracking to motion with displacement scoring

My goal here is to explain how those in the iron game can get more out of their data, not do more unnecessary analysis or statistical breakdown. With coaches having less margin for error, marginal gains only make sense when they show up with big improvements over time. The process of getting more from VBT products that can accurately measure barbell or motion displacement can start with a small step. As you become more comfortable each year, add more analysis to whatever you feel will help your athletes.

Sometimes doing the basics better matters, sometimes mining the data and finding little ways to get better results is the answer, and sometimes just making sure everyone is fairly evaluated with objective information is best. I am a huge fan of doing the tried and true activities sharper and more refined. Using tools that can remove the guesswork and passively collect information saves time. Over the last few years, I have learned a lot from trying to do a better job. I am confident you will enjoy more success in your program with the right information.

Please share so others may benefit.


The post Why Bar Displacement Is a Hidden Gem in the Weight Room appeared first on Freelap USA.

Want to Be a Standout Private Coach? These Ten Tips Can Make It Happen

$
0
0


Athlete Demonstrating Pullups

By Drew Cooper

The business of coaching in the private sector, especially as an independent individual (versus a facility with a staff) is interesting and complicated. I will discuss the path I took, including buying equipment, tailoring marketing to my business needs, making mistakes, and my hopes moving forward. I’ve added some shared stories of the fun, successes, failures, pains, and difficulties of doing a “great job” as a private coach. My aim is to help anyone thinking about starting their own journey to a private coaching career.
*Disclaimer: You can’t buy experience

My Story and Path

Things began with me wanting to pursue kinesiology in college, getting scared, changing majors, then coming full circle to change back and finish with a B.S. in kinesiology from San Diego State. In college I held a job in the café of a VERY affluent gym. The typical client was a millionaire working in some tech or biotech company (Qualcomm headquarters was a bike ride away).

I was fortunate to meet my first mentor in Steve Laubenberg, a coach with experience working with speed/power athletes and loving what he did. Meeting Steve was the beginning of my networking efforts. I bought some training sessions with him, which started a great relationship that still exists. He opened a business out of his garage, and I followed him there. He directed me to websites, authors, and general training info to further my knowledge. I attribute much of my successful beginnings to Steve.

When he notified me of his impending move across the country, I saw this as an opportunity to purchase his equipment. I took a huge risk as a college senior by draining my savings. I bought his GHR, dumbbells, weight plates, barbells, chest supported row, lat pulldown/low row, and various accessories at a price that was unreal, and moved everything into my parents’ garage. I soon acquired my first client. He generated four referrals within the first month. Without the cheaply priced equipment and that first client to get me started, I doubt I’d be where I am today.

I started getting young athletes who happened to be exceptional at their given sports, which of course attracted their peers also to train with me. In about a year, I went from one client in a two-car garage to about 25 clients in a three-car garage. I also added new equipment after selling my old stuff. With word circulating that I had athletes being recruited by schools, two high school coaches called me. That resulted in talks to their respective parents in group meetings. One meeting led to a ton of referrals. The other was essentially a dead end since I couldn’t house the entire team at one time in my garage.

After realizing the shortcomings of a small space, I started looking into larger options. My initial plan was developing an “actual” business. Prices in the area were terrifying, so I attended my first business seminar. It slammed home the point that opening a gym on my own was nothing I wanted to get into. By this point, I had met my now-wife. She was planning on attending PT school.

Change of focus

This convinced me that opening a gym wasn’t a viable goal. I went back to the garage with a new focus: offering a more personalized, high-end, private experience to my clients while reducing the financial risk by keeping overhead to a minimum.

I felt like all I needed to do was be the best possible coach with the tools to provide a high-quality experience. I wasn’t pursuing your typical person who pays $20 a month for a gym; I couldn’t compete with the big gyms in that respect. With a consistent group of clients, I started to upgrade everything from basic to high-end: adding turf out back, a bigger rack with a platform, competition bumper plates, Omegawave Team, GymAware, Globus, FreeLap timing, Oly bar, kBox3, and more. At the same time, I got rid of enough things to make the garage feel more open and a bit nicer. This process allowed me to provide a service that very few could match.

While this updating continued, I did more networking and hired Landon Evans to coach my brother and me to compete in powerlifting. I joke about “networking” because I had nothing to offer Landon for his time other than money. As with Steve, working with Landon opened up a relationship that has benefited me tenfold. I bugged him endlessly about his programming, what he was reading, what seminars he was going to, what websites to read, equipment he liked and how he used it. I still bug him. I can’t emphasize enough hiring people you respect if you can so you can pick their brains—it beats out every seminar I have ever attended.

Taking advantage of good fortune

To recap, I was fortunate to have met Steve, and I took advantage of the situation and bought his time to learn and form a relationship. That led to the start of my business. Steve was just the first of numerous instances of good fortune.

  • I was fortunate that my parents let me start in their house as it was low overhead (read: zero at the start) and allowed me to charge low prices to get rolling.
  • I was fortunate to have a great client at the beginning who referred more clients, and some talented athletes were within those referrals, and I took advantage and worked hard to provide good coaching that made them better and spurred, even more, referrals.
  • I was fortunate to be in an affluent area where people could afford private coaching, and I took advantage and treated intelligent, wealthy people so well that they enjoyed coming in and I was always timely and professional.
  • I was fortunate that Landon took us on as clients, and again I took advantage and learned everything I could and helped him in any way I could so our relationship was mutually beneficial and led to significant growth for me.
  • I was fortunate to work with young athletes who went on to great things. Right now I have guys playing lacrosse at Duke, Navy, Air Force, Middlebury, Drexel, Whittier, Boston, and Bryant. I have had guys at UCSB and SDSU club lacrosse. Two guys in England play English Premier Academy soccer at FC Fulham and Nottingham Forest, and a third with the LA Galaxy Academy. Then there was the one who was cut from his lacrosse team and played sparingly for his high school football team. He walked on at TCU—one of the country’s top NCAA football teams. He was named Scout Player of the Year, and earned a starting spot on special teams.

None of this is to brag, but guys like this are one reason I have done well in my business. The fact that they excelled generated more client referrals. I can say they were (and still are) my most valuable marketing assets. Their hard work and talent have grown my business for me, and I couldn’t appreciate that more. It allows me to maintain my focus on my job—which is to help people improve and stay healthy—rather than generating referrals via website optimization. For that I am thankful.

With all of this being said, here are ten principles I have focused on throughout the years. They have served me very well. I recommend them to you.

One

Be a Better Coach

This is one thing I can never get away from—even if you suck at business but still get positive results, you will probably be okay. This won’t assure you a financial fortune, but it should be the foundation of everything to follow.

I’ll never forget my first business seminar. I was just 22, sitting in the room nodding along and learning a lot of great information I still use today, then going to lunch with a group of attendees to talk shop. The first thing I wrote in my notes after lunch was “get better at coaching because you suck right now.” I underlined it and still have it today. The group of coaches was all much older (I’d say the average age was about 40) and more experienced, so it was a real eye-opener that the business side they were just learning came after years of experience in the trenches getting better as coaches. In my previous articles, I make the point that you can’t buy your way into being better. You need to sit down and work at it over a long period. The take-home is that if you are a great knockdown coach, business will be better, and people will find you.

Two

Be a Decent Human Being

If you are going to charge people to spend time working with you (and hopefully learning), be a decent person. Don’t be condescending, egotistical, or belittling with less-than-gifted clients. Everyone starts somewhere. Either make their time enjoyable or decline to take them on. If you aren’t ready and willing to work with a middle-aged, less-than-motivated, fat-loss client, don’t do it. If you want to be in the world of performance, you need to be honest with clients, and yourself. Learn how to help, motivate, and encourage those who obviously need it. If you take on clients who get less than your best, they can potentially give you a bad reputation that can affect your ability to work with your ideal clients. Bottom line: Treat everyone like they matter. They do.

Three

Define Yourself

This is something I am just learning and paying attention to a lot more with private sector coaches I respect. They tend to have a strong recurring message with what they write and say. For example, I like Mark McLaughlin and Carl Valle. They both are well-educated and have a platform to speak from (NOTE: The following is my personal take on their messages). When I read Mark’s stuff, I typically expect something along the lines of monitoring what you can take action on, taking a long-term approach to development, examining the shambles of youth development—to which he will offer examples and fixes.

Carl seems to know the technology world better than most. My take-home from him typically boils down to

  • Show me the data/proof before you hype some training method/technology
  • Don’t get lost in the 1% when people are messing up the 90%
  • Use technology to provide objective feedback (but don’t get lost in the hype).

While they aren’t limited to these topics, they do come up often, and both of them frequently answer questions on these topics. Essentially they are filling our coaching gaps with specialized knowledge. My point is that if you make a particular topic your area of expertise, you become sought out. Rather than you looking for work, work may start looking for you. But this will take serious effort.

I have failed in this respect by choosing to help everyone from 12-year-olds to 65-year-olds. So my mission now is to zone in on a topic and become better than anyone else. That is a little tongue-in-cheek, but hopefully you get my point. To drive it home, let’s list a few more coaches and play word association:

  • Louie Simmons – Powerlifting/westside
  • Mike Tuchscherer – Powerlifting/autoregulation
  • Bryan Mann – VBT
  • Eric Cressey – Baseball/arm care

I could continue, but the point is that most visibly successful coaches have an area of expertise, and branch out from there because people have learned to trust them.

Four

A Budget and setup

If you plan on opening an actual brick and mortar facility, you need to figure out your setup, potential client population, training system, and expenses. This is an interesting topic with more and more people doing work online and more technology coming out every day. I recently visited Scot Morrison, a great PT in the Portland, Oregon area. We discussed what we would do if we opened up today. We came to the same conclusion: having simple equipment with better technology to monitor the process. If you have a healthy athlete, a barbell, bumper plates, squat stands, bench, med ball, and boxes, you are probably good to go, so starting a small facility doesn’t have to be a huge financial burden equipment-wise. The interesting stuff now (depending on who you work with) is new technology like Omegawave, Ithlete, GymAware, Freelap timing, sleep trackers, InsideTracker, TMG, Myoton, 3D motion capture, and more. The list goes on and on, and you could easily spend a fortune.

The questions become who are you working with, how will you use the technology, can you afford it (knowing better stuff is on the way and for a lot cheaper), and will it improve what you are doing or the results you are getting? It is far too easy to play “keeping up with the Joneses” when the Joneses may suck, not use the stuff they buy, be in serious debt, have pockets far deeper than yours, or maybe even get things for free (if they are attached to the company in some way or testing the product). Again, buying things won’t make you better, so be sure you can justify your purchases and that they fit your business and budget. Don’t climb into crazy debt just to get cool stuff. Start basic and grow slow as the technology available now may be obsolete in five years, whereas a barbell and knowledge last forever.

Five

New marketing/public relations

My brother-in-law recommended a great book by Fraser P. Seitel and John Doorley called Rethinking Reputation: How PR Trumps Marketing and Advertising in the New Media World. I’m also reading CEO Strength Coach by Ron McKeefery. It’s great though Ron’s journey and my own are VASTLY different. Rethinking Reputation instills the idea of new media and public relations being cheap ways to spread the word about yourself or better yet have other people speaking positively about you. For us individual business owners/operators who can’t afford marketing campaigns, things like social media are wildly important. You’d be amazed at the amount of business driven through my garage based on athletes I have tagged squatting on Facebook. It can spread like wildfire since it shows up on their pages, leads to questions, and I get a phone call.

But in all honesty, I went to a couple of high schools to talk a while back. Other than that my entire business has been word of mouth. If I go out and tell you I’m good, you may scoff. If one of your friends tells you I’m good, you tend to believe it. This brings us back to being good at what you do and being a decent human. Otherwise, those leads disappear very fast and turn into people badmouthing you, which can kill business. So use social media to your advantage—not to brag to other coaches, but to complement existing clients and potentially drive their social world to ask about what you do as a coach. Remember, you want happy clients talking about you to their friends. I’ve found it to be the best way to build trust in new clients.

Six

What is important to you? How do you define success?

Another story from the business seminar I attended years ago was the realization of what “owning a gym” actually entailed. There are a ton of new responsibilities, headaches, and expenses that come with the opening of a true facility. I wanted to coach more than own a gym. You need to decide for yourself what “success” is. Do you want to coach elite athletes? Make a mid-six- figure income? Be known nationally as a speaker and expert in a topic? Or some combination of those? Because I define success as being a great coach, having financial security but maybe not the biggest income, freedom to study and spend time with family, and the ability to work from home doesn’t make that definition right for you.

I find it important to have a purpose behind your work. Otherwise, you end up floating around and frustrated because things aren’t what you expected even though you never defined those expectations in the first place. To go back to the seminar, I learned several things:

  • I want to be in the trenches
  • I like learning more about training and performance
  • I want to hold conversations with great coaches
  • I want my clients to get better results with me than anywhere else

Sometimes I think I’m driven by the fear of not being a very good coach, so I end up investing more time to learn more. But I don’t get that same feeling from being a “business owner” (however, you can’t neglect this, as you’ll see in #10). I don’t get excited about thinking of marketing strategies, insurance payments, expansion, or hiring new people. To be quite honest that sounds awful TO ME but it may sound good to you, so figure that out. This process of figuring out what is important to you will help dictate decisions moving through your career and may change with time (it most likely will) but don’t put it off.

Seven

Be a professional

This piggybacks with point #2 of Being a Decent Human Being in that you need to treat people in a professional manner whenever money is being exchanged. This is a bigger deal than you would think. If you stay small and private as I have, you begin to forge relationships to the point that your “clients” become more like friends. This never gives you the right to show up late, eat on the job, dress inappropriately, or use language that would bother your grandma. If someone is paying you for a service, always deliver that service in a professional manner. I have often paid for coaching and PT. The one thing that immediately pisses me off is someone walking around eating, not taking notes, not testing/retesting, or anything else along those lines. So show up early, dress appropriately, eat during your breaks, and be present because clients notice these things and it goes a long ways toward keeping them satisfied—and coming back.

Eight

Pedal to the metal! Always!

This is one of the most painful lessons I have learned. It is FAR too easy to take your foot off the gas when things are going well. You’re busy, people are happy, checks are coming in, and you get comfortable. The problem with getting comfortable is that kids have a season for their sport, adults go on vacation, school gets busy, people move, athletes graduate and move away, etc. So don’t stop trying to spread the word. There were times I told kids not to tell anyone about me because I was “too busy,” only to have lacrosse season hit and my schedule get cut in half. Now guys are off in college, referrals slow down, business is tougher, and I have to go back out to talk to coaches at the high schools to offer my thoughts and try a drive a new crop of athletes through my doors.

If I had just continued pushing the word out, I wouldn’t have to be out talking again. I’d be in the garage doing what I love. If you’re not growing, or people don’t hear about you, at some point business will slow down. If you get so busy you can’t handle it, keep pushing and raise your fees, offer different options like online coaching, or start doing large group conditioning work to continue to stay in touch with the newer, younger athletes to prevent all your athletes from picking up and graduating at the same time.

Nine

Open doors and don’t burn bridges

If I were to go back to my college self, I’d try to convince myself to go further in school and get a Masters, Ph.D., or DPT degree. That would result in more opportunities beyond training people in a gym. Higher education opens the door to teaching at the university level or gaining specific knowledge in a field where you can possibly consult/work for a tech company like Omegawave or Catapult. The DPT route allows you to accept insurance, teach, or have a salaried job higher than a personal trainer. Typically potential clients trust you more.

Do you need higher education? Absolutely not. We can all point to a ton of examples of successful people with just an undergrad degree. On the whole, however, higher education opens more doors. Then it’s up to you to take advantage and monetize the opportunity.

When I say don’t burn bridges, I mean that every relationship you build is a source of potential referrals and further business. If you have problems with someone, try to end on good terms even if that means swallowing your pride a little. In the long run, it will typically be in your best interest to have happy clients, past or current.

ten

Once you decide to be a private coach, you become a businessperson

One thing I hear all the time is “I don’t want to worry about the business side, I just want to coach.” There is nothing wrong with that; just don’t go into business for yourself unless you are already established, have a following, and are a great coach. If you plan on starting out fresh with no real experience, you better learn how to network, sell, market, and “do business,” otherwise you will get crushed. There are tons of examples of great coaches failing and awful coaches thriving in our industry (as well as others). Typically it comes down to smart business decisions, a good demeanor or personality, and the ability to sell without sounding like a salesman.

Think of it this way: If you are good at what you do, and you want to help people, it’s only right to sell so people don’t end up getting hurt down the street at some abomination of a program. I think it’s a good gut check to ask yourself that if you truly are as good as you think, why aren’t people knocking on your door? I ask myself that sometimes and it usually comes down to the fact that I haven’t done a good enough job keeping the pedal down and reaching out to more people. Business isn’t easy, and none of your competitors are out to help you. At some point you have to put the stubbornness aside and be a business person, or find a job as a coach and work as an employee.

Concluding Thoughts

When all is said and done, being a private coach is far more than writing a good program. As important as being a great coach is, it is more important upfront to be a fantastic salesperson and a genuinely nice person. When I say “salesperson,” I mean a combination of communicator, educator, and actual seller. It is important in our field—rife with utter bullshit spewed out of every media outlet, infomercial, supplement ad, TV show, and layperson—that we know how to communicate concrete science efficiently and effectively so that we can foster trust in our abilities.

To tell someone that carbs aren’t the devil, sleep is important, heavy weights won’t make you bulky and slow, or whatever other misinformation you come across in the world of exercise is a matter of educating. The word “selling” refers to the delivery, not the material. You are educating in a non-threatening, easy-to-understand—maybe even humorous—way. Building trust with strangers can be rather difficult so don’t lecture and call people names. Most likely the “idiots on TV” already have the person’s trust so calling them names won’t help.

Last, this business isn’t as unique as we like to think and make it out to be. Like any business or industry, some people suck, some are okay, and others excel. If you truly want to excel as a coach and business owner, it takes time and effort. It’s not always rainbows and unicorns, and even your ideal clients will drive you nuts at times. My recommendation is to become a flat-out knockdown coach, be willing to take a calculated risk on yourself, and don’t feel like guys like me have everything figured out because I’m writing an article. I make mistakes and get frustrated with myself constantly and question whether or not I should continue working on my own, so we are all human.

*A final note. Before I completed this article, my wife and I moved to Northern California and left my business to my brother in San Diego. We have had serious talks about what I’m going to do now. Is it worth the risk to build a new gym and business here? Should I go back to school? Maybe even a complete change of business? At the end of the day, I don’t think there is anything else I’d rather do; however, that choice does not come easy. I question the risk versus passion. Just because I love the field and really can’t see doing anything else with as much drive, the risk can be so high working alone that sometimes plain old security sounds like a fairytale dream. All in all, after 7+ years of working alone in a field I love, I don’t think there is anything else I could do. I have knots in my stomach but look forward to what comes next.

Please share so others may benefit.


The post Want to Be a Standout Private Coach? These Ten Tips Can Make It Happen appeared first on Freelap USA.

The Science of Force Plates and Pressure Mapping

$
0
0


Foot Pressure Mapping

By Carl Valle

If you follow the latest innovations in sports performance, you have seen the use of force plates moving from the research world to professional teams and colleges. Some private facilities tout them as ways to decode what causes injuries and what holds the key to improved performance. The use of pressure mapping to solve complex foot and lower extremity injuries among elite soccer clubs is even more intriguing. I have used specialists who leverage the technology to add more insight to their craft since 2001, and seen how the research and clinical experience can really make a difference. On the other hand, a lot of bogus claims keep us stuck in the mud as a profession.

Counter-movement Jump Force Time Curve

Figure 1. The force/time curve of a dual force plate synchronized to capture right and left leg simultaneously. Some systems being touted use one force plate and average the forces, a major weakness.


Several times a week I muster the same long email responses to many myths of using a force plate with strength coaches, and the problem is trending now. Several providers of force plate systems and services are growing in popularity—Sparta Science, P3, Andy Franklin Miller, and more. Accelerometer-based products like Bar Sensei and Push have made efforts (some successful, some still needing evolution) to capture force production in the weight room. The Australian system GymAware provided a solid proxy to force output for years, and coaches love getting instant feedback with elite athletes.


Everyone can learn from the science of Newtonian physics to help their athletes.
Click To Tweet


Finally, we have the surge in pressure mapping tools that improve cleat or boot fit, as well as adding another perspective to gait analysis. Tekscan, Novel, and Moticon systems are solving problems for sports medicine professionals as gait analysis is growing and becoming more practical. Coaches and sports medicine professionals are realizing that instead of using research to validate general concepts, it’s better to research their own athletes with the same instruments they are reading about in the literature. This is a great idea on paper, but when the rubber hits the road, it can be a very dangerous course.

This article will straighten out what is going on with force-time curves in sports motion, specifically with the common approaches of using force plates for jumping and pressure mapping for screening foot strike. Not everyone will be investing into $20K systems, but everyone can learn from the science of Newtonian physics to help their athletes.

Beware of Geeks and Greeks Bearing Gifts

Several professional teams have asked me what the best force plates are. Others wonder if pressure mapping will be the next big thing and worth the investment. My response has and will always be the same: Never purchase anything unless you can interpret the information the instruments measure.

A force plate is a simple tool that records the body mass and muscular output changes into the platform surface over time.

That is all. Interpretation should not be more than how forces are created and transferred in that sporting movement. Extending out to diagnose specific injury or fatigue risks is getting into crystal ball country, not predictive analytics. A vertical jump is a useful action to peer into the nervous system, but biomechanically how jumping with two legs up translates to sprinting on a grass field or changing direction in basketball is limited. The use of force plates in professional baseball perplexes me. It may be great to see how leg power is modulating, but expecting it to help keep pitchers healthy is a pipe dream.

My concern is that professional sports teams are extending the value and significance of the force-time curves beyond what the science is telling us. This is not just voodoo or wishful thinking;, it’s closer to snake oil. Jumping vertically has some value to coaches and even sports medicine professionals, but to distill injury risk to a vertical jump profile is analogous to diagnosing disease based only on a stethoscope.

If force plates could solve our injury problems, it seems that many teams are either not using them or failing to take advantage of the data. Injuries are still piling up. Remember that the technology is older than the players currently in professional sport, so if it were a Holy Grail, we would have found it when everyone was rocking cassette players and watching The A-Team.

Moving to another solution that captures force-time curves, the use of pressure mapping devices is going to get more popular now that the technology is more user-friendly. Pressure mapping is basically using an insole of sensors to see all the changes in vertical forces that interact with the foot. While not a force plate inside a shoe, the data does have validity to see relative force. But the absolute forces are not perfect.

The technology is designed to measure how each foot strike distributes its respective forces through the ground at a high sampling rate—how many times the device is measuring per second. Some devices collect data like a high-speed camera. Amazing stuff, but like any tool it requires a lot of education to do more than show cute charts to sportswriters looking for a good story on “data” or “science.”

Looking at the data, medical professionals can solve for abnormal issues and make better decisions on footwear, orthotic interventions, therapy, and rest. All this technology is currently being used in research. The objective measurements can be used to help professional teams get better and define problems with more resolution. The promise of reducing injuries and improving performance sounds great on paper, but let the buyer beware. Many hardware systems eager to get sales are matching up with thought leaders to sell more of their products. You need to know who is providing genuine education and who is just marketing dubious science.

What Force Plates Actually Measure

A medical-grade force plate and the right software can dramatically reveal important changes to athlete function if used correctly. Three variables are clearly needed. Any break in the chain will make a force plate a very expensive toy for organizations, who will realize it is collecting dust when a new performance staff brings in the flavor of the month as the coaching regime changes.

Net Impulse Force

Figure 2. Satoshi Mizuguchi’s thesis on net impulse illustrates the time course of how power creates a jumping action. Reducing a jump into 2-3 bar charts is like summarizing the complexities of an EKG as only beats per minute.


Force plates are simply a few square meters of measuring ground reaction forces. They are mainly useful for vertical jumping and sometimes sampling a running step if integrated into a high-speed treadmill, but they are just one shade of the necessary colors in a pallet of data to create a complete picture. Remember that force plates can provide only the following:

The amount of force one can transfer into the ground over time.

This summary is basically the limit of direct information a device like a force plate can provide. Not to oversimplify, but force plates are not much different than weight scales sampling at fast speeds. Sure, calculations and sometimes estimations of other metrics like peak power, mean force, and other scores can be acquired when the time segments of the force-time curve are dissected, but some pundits are extrapolating a lot from one set of numbers. The body is a complicated orchestration of many movements and joints. One gross time curve isn’t the same as adding video or motion capture, so don’t “jump to conclusions” with a line plot on a flat screen in a gym.

Since most of the time people are extracting force profiles from bilateral vertical jumps using a single force plate, the information is junk when they don’t know if one limb is experiencing a poor neuromuscular performance. It’s truly amazing that many teams spend more than $50K on one force plate and repackaged software, when even a dual force plate system still needs video or motion capture to see the relationships of forces and motion of the body. Add EMG and now you are getting close to the whole picture. But keep in mind that research data is not team-friendly, so compromises are often made to do repeated measurements. Also, keep in mind that a research study may take a year or more to be studied and published—much different than the need for instant guidance.

The common and appropriate use of force plates is an attempt to gauge how power from training and subsequent rest interacts with individual athletes with primarily jump testing in the vertical plane. Bilateral jumping does indeed have some relationship to gross leg power in many sports, a prime variable to reducing injury and increasing performance. General leg power is not the golden ticket to running fast or reducing the dreaded ACL injury. It’s one part of the equation that is appropriate to test if properly sampled and interpreted. The problem now is it’s a wild west of unproven collection techniques, poorly executed analysis, and diluted reporting with cartoony graphs that would make the best sports scientists vomit. Yes, it’s that bad. But it’s like Santa Claus—everyone wants to believe because he brings toys every year.

What pressure mapping can provide for sports professionals

Peak Forces

Figure 3. Peak forces are important for absolute reference, but the timing of the forces (left chart) shows it’s about how heel-to-toe pressures matter. Here right and left foot data are compared with the Tekscan software.


Pressure mapping can come in different forms. Sometimes it’s a walking mat or strip of carpet-like sensors, sometimes it’s a completely wireless thin insole. Think of an LCD screen with tiny pixels, with each pixel detecting various levels of pressure. The primary use of pressure mapping is ensuring the gait curve (force-time curve specific to locomotion) is in harmony with the anatomy of the subject it’s testing. Most of the time the data is used in podiatry, attempting to improve outcomes with such unfortunately common problems like diabetic foot ulcers. It’s growing with sports medicine as a testing service because research is discovering how the foot and lower extremity better interact with the ground and shoe better.

Ground Reaction Force

Figure 4. The force-time curves using the Moticon device and software are displayed above. The right-foot data is likely picking up a past knee injury—the athlete in question is actually me.


Not only does pressure mapping summarize force-time curves, but it can also capture the Center of Pressure (COP). While not a perfect definition, the COP is averaging the forces between the length and width of the foot every fraction of a second. The image below is a good illustration. Note the black line showing the summary of the distribution of forces through the sole of the foot, in addition to the peak forces with corresponding color codes.

Running with Orthotics

Figure 5. The COP or Center of Pressure is the black-and-white mark. You can see how orthotics changes pressures while running. Sometimes athletes are highly responsive, sometimes they are not and may find the intervention making the problem worse. Objective measurement helps find the right cleat or shoe fit.


The technology of pressure mapping is amazing and very useful, but clinical and research findings can evoke strong disagreement regarding the implications of the data. Ask a researcher what the findings of pressure mapping are. Usually, the response is “limited.” Ask a clinician, and the responses can range from “it depends” to “a staple in addressing problems.” The truth is that pressure mapping is medical imaging with motion. One needs the entire picture to make improvements, or the results may not surface.

My biggest criticism of research that analyzes forces and joint motion with pressure mapping is the poor study design construction. Getting 20 test subjects statistically summarized with crude foot evaluation approaches is antiquated, and not informative at all. Each foot is similar to a moving 3D fingerprint, rich in detail and individualism. While each subject may have similar data in the findings at the end of the investigation, how they get there is highly variable and often not included in the researcher’s conclusions. For example, some feet look anatomically different yet perform similarly, while others that look nearly the same may perform far differently. Taking the body’s most complicated joint system and summarizing it with rough labels such as “flat foot” or “high arch” is like using Starbucks sizing for a wedding dress fitting.

Orthotics has a polarizing reputation—sometimes getting too much credit, sometimes being attacked for doing “nothing” for athletes. Like prescription medication, orthotic treatments treat a problem that needs a lot of patient information to help. In the past, blood transfusions had a huge failure rate because many donors didn’t match blood type, so the body rejected even “healthy” blood. When athletes experience injuries, most of the problem is managing the training load and preparing the body properly. But some variables can’t be fixed with better strength training and training plans.

Orthotics are static devices and can address some problems, but they can’t fix everything. We have a myriad of coaches inspecting shoes and trying to match the right ones with their athletes. A shoe is an artificial addition to the foot, so those who want a natural orthotic-free fit often use a running shoe or cleat that unknowingly changes how the athlete interacts with the playing surface.

The goal of pressure mapping is to reduce aberrant forces that demonstrate direct pathological effects. Most of the impact of orthotics is minimal. But so is the difference in the modern NBA between winning and losing, and getting hurt and staying healthy. The fine line of what can injure an athlete pushing the body maximally can’t be summarized with conventional statistics, so modeling biological tissue and repair rates is what we need more of, not convenient statistical software packages that work for voter polls and crime figures of cities.

Pressure mapping is nothing more than an objective way to enhance what a good foot evaluation and gait analysis are already doing. It’s valuable to see direct problems with the foot, and indirect problems with the lower extremity and higher up. The pelvis and its function have a small influence as the body is interconnected, but it’s not as strong as many want to believe.

Many therapists feel threatened by podiatry as they don’t have the same education or even medical ability to influence what is happening below the knee. Like a psychologist who can’t prescribe medications like a psychiatrist, therapists should focus on what they are more qualified to handle and use a combined approach. Core training is an obsession, and if it were solving the world’s problems, we would have been saved from since the stability ball invasion of the late 1990s. Core training has been around since the dawn of time, and it’s not working as well as we want. So it’s about seeing every part of the kinetic chain that interacts with the ground.

Hardware, software, and marketing games

Raw Science Data for Foot Pressure

Figure 6. Good software should show all the data, not filter it. Having the data analyzed in an automated fashion is fine, provided the calculations reflect established standards of sport science research.


Most systems that elite teams and universities buy are usually bundled together, meaning if you purchase a piece of equipment you usually use the company’s software as well. As a user of sports technology for years, I know that what’s included can vary from amazing solutions to vomit from lazy software engineers who have no pride in their work. Many companies try to sell “added value” systems by tweaking existing software to make it appear more advanced or special. Usually, though, it’s nothing more than a logo swap and a few features.

Jump Parameters

Figure 7. Calculations should be based on accepted sport science formulas, not proprietary or in-house metrics. Sometimes it’s fine to have new calculations, provided the math and its origin are explained.


WARNING: The biggest pitfall in sports performance technology is ignorance of what the hardware can do and how the software spits out information. Some companies are truly innovating and pushing faster than research as equipment and data are surging in availability, but anything proprietary is still likely to marketing hype. The best solution is to send the marketing claims to sport scientists who spend 100% of their time looking at the same data and see if any merit exists. Most of the time it’s like a new supplement—lots of promise but little actual effect or scientific proof.

A great solution is software that displays data clearly and doesn’t try to do too much. Coaches need transparency, not filtered glitter data. When one is estimating on estimations, calculations become random number generators. Coaches need to understand the difference between a direct measurement and a calculation. I roll my eyes when sales staffs use the magic word “algorithm,” thinking it’s a discovery rather than a formula that estimates what is happening with advanced mathematics.

Solutions with force plates and pressure mapping

Many professionals interested in buying instruments feel the pressure (pun intended) from management, peers, and athletic directors. Sometimes athletes will ask as well when social media and the YouTube world hype force plates or show Cristiano Ronaldo getting fitted for cleats. We are seeing elite athletes getting 3D printed orthotics now. The technology will soon be available everywhere, not just with pros. My concern is that people forgetare forgetting the simple and big perspective. I frankly hate listing or summarizing, but the two tools I’ve discussed mainly take care of three primary needs.

  • Force plates are great for jumping and getting power profiles with a lot of granularity in force production. Contractile dynamics of the neuromuscular system can be dissected a bit, but the conclusions are very general, and specifics to other motions are limited.
  • Pressure mapping is great for screening injury and performance in conjunction with gait analysis. Decisions based on foot function and the relationship up the kinetic chain can be deciphered with a holistic approach and other data feeds.
  • Both pressure mapping and force plates can help athletes return to play by analyzing rehabilitation progress.

Both tools help athletes, but to create training programs in the weight room from a force plate is asinine. Using pressure mapping without a comprehensive clinical foot evaluation by a professional is also foolish. In summary, force plates help show how the strength program is doing and maybe how some fatigue is interacting. But the reality is it’s not to develop athletic performance, just likely lower body power and balance. Pressure mapping is designed to fine-tune foot/ankle function and footwear, not diagnose injury alone.

Solution 1: Performance changes and testing

Most coaches try to observe development with their athletes. Elite athletes have reached a high level of success in their sport, but are not finished products. Due to the constraints of travel and team game schedules, athletes compete underprepared because everyone allows it, including the players themselves. Let’s face it—most fans come to preseason training because they want to see some action. Nobody is going to pay big-ticket prices to see teams do small-sided games and half-court scrimmages. The goal of professional and college athletes is to ensure that biological, chronological, and training ages are equal. Instead of listing three bar charts from a vertical jump, it’s better to test multiple exercises and sport movements and just look at the force-time curve in detail.

Solution 2: Medical screening versus medical diagnostics

Modern medicine usually identifies structural damage to anatomical points of interest as a diagnosis, provided it is coupled with clinical findings that match the imaging. Medical imaging isn’t going away soon, but functional outcomes in foot mechanics are growing in value. What is confusing is the difference between modern athlete screening and medical diagnosis, when many methods overlap and are similar. Here is the core summary:

  • Screening – Athlete risk can be appraised when the etiology of common non-contact injuries is compared to evidence-based practices. Screening is done before one is injured to identify risk factors that can increase the likelihood of neuromuscular faults to joint and soft tissue.
  • Diagnosis – Pathomechanics in conjunction with athlete clinical findings can enhance the confidence in the mechanism or severity. The main purpose of using pressure mapping and force plates with injuries is to restore the athlete to baseline or construct an intervention and return to play program.

Pressure mapping and force plate analysis can help with injury screening and diagnosis, but the literature is exhausting and must be combed over. Currently, no software magically creates a diagnosis or screens injuries without expertise, but the calculations can be interpreted with mild education.

Solution 3: Jumping, throwing, and running analysis

Teams, academies, and colleges measure common movements in sport and try to see what motions and forces increase injury risk. As mentioned earlier, a lot of variation between athlete populations and genetics that may make up much of the data are not specific enough to explain everything. Very few marathon runners tear ACLs unless they step funny, very few athletes pull hamstrings jumping up, and very few pitchers tear Achilles tendons on the mound. In general, based on the rates, injury type, and population, the sports world is trying to do the following with force plates and pressure mapping:

  • Create a sensible symmetry to increase the probability of performing well and reducing injury. As speeds and forces increase, so does injury risk. Some asymmetry is normal, but the body has only so many resources to manage forces that are not in harmony.
  • Identify researched factors known to be etiological points of risk for injuries. Some cardinal variables to injuries are valid, and simple things like landing can be assessed with force plates in addition to video.
  • Control and manage forces in combination with the athlete’s shoes or cleats to ensure comfort and appropriate levels of function. Ski boots and skates are much different than track spikes and football cleats, so one is trying to ensure that no factor is causing damage or increasing the indirect risk of injury.

Throwing athletes should use force plates to manage ground reaction responses by measuring their throws. Runners and sprinters can use treadmills or measure foot strike by sampling a few steps. Jumpers have perhaps the easiest and most direct option—simply testing their sporting style. Testing what people do isn’t rocket science and is not novel, but using jumping for every sport is too narrow and not valid for deducing specific risk or dissecting impairment.

Baseball Force Plates

Figure 8. Baseball force plates. Why not just measure the sport action directly, not just gross training exercises. Relationships to general training and sport specific action can be teased out with some investigation, but only testing jumps and not activities that are the problem is strange. Cutting, sprinting, and throwing should be looked at, not just vertical jumps.


Parting wisdom on measuring forces from the feet up

It can be nerve-racking when unfamiliar technology that holds a possible promise of improved sports performance appears. Don’t worry. Remember that jump testing, cutting, and running are all areas that coaches can help improve, and sports medicine professionals can screen and rehabilitate. Measurements help add more precision to what we see, and the goal of the technology is to assist professionals, not replace them.

Some amazing athletic feats happen because great talents do a lot of special things quickly and forcefully into the ground, and that data can be collected and reported instantly. Now and in the future it’s expected that the simple line plot of forces can be measured and improved when good technology meets great people, and education can pave the way.

Please share so others may benefit.


The post The Science of Force Plates and Pressure Mapping appeared first on Freelap USA.

How to Use the kMeter to Develop Eccentric Power

$
0
0


Eccentric Flywheel

By Carl Valle

The kMeter is a simple sensor that estimates work done with the kBox flywheel system. Many coaches ask me about how I use it. The honest truth is that I see what everyone else is doing, and cut out what may be just style or preference. Coaches and sports medicine people need to understand that it’s the best available tool for users to get unique estimations of work done without using force plates. Obviously with any training tool, you always need measurement to improve results or the consistency of results decreases. This article is specialized for users of kBox, but anyone wanting to learn how to improve performance will benefit by seeing what most sports need with strength development.

What is the kMeter and what does it do?

I was the first person in North America to get the kMeter. My first question was what does it do. The second was what should I be aware of with regards to what it doesn’t do. The kMeter is a relay sensor that sends data from the flywheel to an Apple device via Bluetooth. To appreciate the major convenience and value this solution provides, understand that entire companies do the very thing we likely take for granted when looking at our iPads or iPhones. The flywheel data is raw information, and the software converts it into usable scores. This information is all near real-time, and I wrote about biofeedback in another article. The scores are basically details of the work done per repetition of the kBox. Much of the innovation is making hard calculations instant.


The Exxentric kMeter converts raw flywheel data into usable scores in real time.
Click To Tweet


The kMeter is not a force plate, and the data comes from the flywheel, not the kBox surface. I bring this up because sports professionals must appreciate the refinement of the mathematics, not hardware or app design.

kMeter Analysis

Figure 1. The new app upgrade allows for horizontal landscape view for analysis. Connecting to a flat screen with and Apple TV console is a perfect solution for biofeedback with athletes


I spent six months validating the data I was capturing from the kMeter. I needed to know if the numbers were real. After thousands of reps, I am content that it is. To understand this commitment, think about spending ten hours a week making sure estimates from the sensor are enough to show strong evidence of the outputs during training. The sensor is not designed to do anything besides estimate work from the machine, but just having data from a very difficult to measure force is extremely valuable to coaches and medical professionals. Measurement is especially important now in sport, and the most exotic forms of resistance are more manageable.

What the technology is doing and what the software is calculating

The flywheel momentum is received and then sent to the app for calculation and data visualization. Several metrics are listed, and most coaches want to know what is on the bar charts, so let’s review what the inputs are manually and what is being calculated in the back end of the software.

Average power – Mean power output of the repetition is expressed in wattage.

Concentric peak power – The top wattage during the concentric action of the repetition is expressed in watts as well.

Eccentric peak power – The top wattage during the eccentric action of the repetition is expressed in watts, like the concentric portion.

Average overload – The average overload is the difference between concentric and eccentric actions. This can be net zero or a positive/negative percentage.

Relative peak power – Based on self-reported input, the relationship between the user weight and the peak power output of the exercise is expressed in watts/kg.

Energy – The conversion of work done is expressed into kilojoules, a less conventional but appropriate summary.

Repetitions – The number of repetitions performed. Remember, you can select different pre-reps based on how athletes get the flywheel going.

Average rep time – The mean duration of concentric and eccentric activity, without adjustments to distance. Rep time should be compared to vertical motion, a great composite metric I predict will soon gain interest with coaches.

Vertical motion – How much displacement vertically the user is creating, expressed in centimeters. The distance looks very good when compared to LPTs and video, so it’s a good idea to use this for depth of motions to audit exercise technique.

More information like actual rep-by-rep details is shown live during the exercises so that you can toggle between average power, peak power, and peak force. A line of statistical averages is shown when the work is compiled. Clearly, a lot of information can be collected rapidly. The goal should be to do the exercises correctly with great effort, and start using the information over time to make live coaching interventions instead of robotic responses to screen data.

How does one coach with the kMeter?

The most common question I get about the kMeter and kBox is how do I coach with the live feedback? Most people believe I will talk about “personalized thresholds” or “eccentric ratios.” But the truth is that I care about the quality of the workout. I want engaged athletes focusing on the task, not about numbers or anything else until the session is over or they need to know how they are doing after completing a set. I have only been using the kMeter for a short period of time, so I don’t have the perfect system.

Exxentric kMeter

Figure 2. The Exxentric kMeter attaches to the bottom of the kBox and connects to an iOS device using Bluetooth.


My Velocity Based Training articles have stressed the need for objective feedback, and it must be done carefully. When athletes do heavy snatches from blocks, their feedback is completion of a quality rep, not seeing how many watts they got or the bar velocity. The job of the coach and fellow athletes is to support with old-school fervor, getting rowdy or being supportive. I want laser focus and athletes can always get the data seconds later if they need to. Remember, at most stations athletes are usually changing weight plates. Because of the nature of the kBox, instant feedback is more accessible. The resistance is the body and flywheel, not a plate with a unique load. A kBox environment is a harness or bar attachment, something with fewer moving parts besides the machine itself.

kMeter iOS app

Figure 3. The kMeter app can be installed on an iPhone or iPad and connects wirelessly to the kMeter using Bluetooth.


The most common approach with small groups is the coach using the kMeter just for arousal and awareness. Individual athletes can get more out of it because they are not sharing the device and can interact with the app more. The kMeter works like a charm in sports medicine and private training. The UX (user experience) is getting better to be more team-friendly. I am comfortable with small groups of 3-5 athletes, and I believe the enterprise option will be even faster and more simplified in the next year based on how things are trending.

So what does a kBox session with live kMeter output feel like? An organized riot! The process needs to be hands-on and collaborative with everyone supporting the eccentric rush and encouraging self-punishment with a solid push through to get the “taste of one’s own medicine” back. When I used this with my friend Jason during last winter, it reminded me of Mad Max 3 and everyone loved it.

Coaches are going to want to use an Apple TV and a cheap flatscreen hooked up to get the mobile device projected. With the iPad mini being cheaper than regular Apple tablets, I use it and a good case and treat it like a large remote rather than a small screen. Keep in mind the audio component on rep feedback from the app uses a voice to help count. My only wish is that more sound options exist like custom recordings. I don’t know who I would use, but I bet Scotty Cochrane could easily increase the output by a statistical level.

Exporting data for later use

My first fear was that feedback was live but couldn’t be exported. The current app allows for email export similar to many early apps, and that is a necessary feature. What one needs to remember is that the file exported is a CSV (comma separated values) file. While Excel can open it, the file is not an Excel file. Many statistical packages require formatting to be adjusted based on the layout of the data, so I suggest using a script or macro to automate the process for both time and error reduction.

kMeter Export CSV File

Figure 4. With a just two taps exporting is quick and easy via mailing a .CSV file, but the future will likely be Cloud storage syncing and with an API to push the data into Athlete Management Systems.


Down the road, I would like to see Dropbox and other cloud-synching options as well as an API that can pipe the data right into AMS products, so data doesn’t have to be manually cleaned and sent. All of this will come in time as more and more kBox users evolve the art and science of flywheel training.

What to analyze for athlete progress

Most coaches are going to want what nearly everyone wants: MORE. Progress is not seeing gradual improvement or similar oversimplifications; it’s about making smart decisions of knowing when to push and when to let go. Eccentric training is the necessary demand for playing with fire and making sure one is unscathed. The difficulty is not training with the kBox in isolation; it’s knowing how it can play nice with other modalities. What I have experienced to be simple and successful is looking at the amount of total work done in the training program and see how much flywheel contribution is involved. From there I want to see if the flywheel is augmenting important metrics to the program.

For the first few months, coaches want to see if the added or integrated work is helping performance. This of course is hard to do without controlled trials in research, but good recordkeeping can hint to what is influencing what.

  • Flywheel training must improve flywheel measurements. What this means is the simple and direct change with exercises needs to get better for the training to have a chance in other areas outside the exercise.
  • The eccentric utilization ratio must show a minimum worthwhile change. From my own records, heavy kBox use with soccer can increase the ratio by .15. But the total numbers all improve, thus, the small increase may be deceptive.
  • External testing with sonography (fascicle length) and basic strength tests can measure the eccentric adaptations. Also looking at muscle changes in size via modern perimeter tools is important for knowing what is targeted. EMG can be done as well, and interpretation is best done by a sport scientist or knowledgeable professional.

Deeper analysis for advanced athletes and the future

I have less than a year of kMeter usage, so I want this article to reflect standard practices that anyone else could come to from loyal use. The future will be similar to Velocity Based Training, and it’s going to have many of the concepts of kinetic analysis from force plates. Deeper analysis can be done by using the exported data and seeing relationships with the flywheel training internally, and the connections outside the modality and into pure athletic motion. I have three predictions of what will be coming down the pipeline with the kMeter with analytics of eccentric training.

The current app only tags exercises. This is a self-reporting label of the outputs relative to the movement pattern and even self-reported flywheel load. Just like every VBT product, weights are inputted by the user, so expect exercise corrections for anatomical impact. One example is the squat-to-RDL pattern I love. What is going to be important are the three outputs (average power, peak power, peak force) and what they mean to hamstring adaptations. Technology does not make coaches an endangered species. They become even more important to ensure athletes do what they are supposed to do.

Concentric peak power and eccentric peak power ratios are not a Holy Grail, but neither are they a throwaway Dixie cup. To know the work being done with more granularity, more research is needed to see how dissipation of forces from joint angles with force-time characteristics are interrelated. The flywheel overload is a misnomer since thermodynamics and machine efficiency impact the eccentric load. The truth is that kinetic forces redirected from the flywheel are not higher than the incoming concentric force, but how they are received is what coaches want. As this becomes a more important metric, expect refinements in the kBox when the science starts to catch up to the innovation.

The kBox is portable and durable, but things are going to get even more brutal as the community constantly experiments with it. Already we are seeing some great stuff by American coaches who have had less exposure, so what was possibly a weakness in accessibility is now a strength from something being new and exciting. I predict a huge ecosystem of support products and education as the system becomes more consumer friendly.

The power of the crowd

This article is just a review and exposes the surface of the kMeter, an important instrument that helps quantify the hard-to-measure outputs of the kBox. I am a believer in this technology and have sometimes been too skeptical of machines as I am a purist in training (gravity and motion). Now that I have done my homework with research and actual experimentation, I no longer feel as closed-minded.

If it weren’t for several Spanish coaches and my friend and mentor Hakan Andersson, I would be stuck thinking the option was for “Euros,” not somebody more hardcore. The kMeter is a user-friendly tool that kills off the antiquated laptop and makes data more accessible and useful, and I am confident the future will be brighter. I am not the thought leader in flywheel training. That is the crowd of great people who share their experiences and expertise openly. As the community grows, I see more adoption to help athletes improve performance and reduce injury.

Please share so others may benefit.


SimpliFaster Exxentric kBox

The post How to Use the kMeter to Develop Eccentric Power appeared first on Freelap USA.

Resisted Sled Sprint Training – Part 1 – Methods of Sled Load Prescription

$
0
0


Sprinter Pulling Sled

By George Petrakos

Resisted sled sprint (RSS) training is an effective method to improve linear sprint performance – but how do we load the sled?

This article will provide an overview of the current methods of sled load prescription for resisted sled sprint (RSS) training. We are at a very early stage of quantifying the potential of RSS training for improved sprint performance. However, before we can effectively apply RSS training with our athletes, we have to understand why and how we are loading the sled.

The Benefits of Resisted Sled Sprint (RSS) Training

Physical training improvements in sprint performance can occur via two general means:

  1. Increase in physical output
    • e.g. increase production of triple extension force/power
  2. Improvement in efficiency of physical output
    • e.g. increase in horizontal application of force

Sprint acceleration performance is largely determined by the angle of application of ground reaction force [1-3]. JB Morin and colleagues summarize the mechanical determinants of sprint acceleration as a ‘technical ability to apply horizontal force’ (Figure 1) [2]. RSS training is a tool to provide a potential improvement in horizontal application of force.

Force production during sprint running.

Figure 1. Vertical force (FV), horizontal force (FH), total force production (FTOT) during ground contact in sprint running [2]. During acceleration (a) the ‘technical ability’ to apply horizontal force and (b) the ability to limit the rate at which angle of force application is decreased are key mechanical determinants of performance [2].


We constantly strive for effective and efficient methods for training transfer to performance. For an overview of ‘training transfer’, please read this top quality piece by Warren Young [4]. RSS training is likely to provide an enhancement of both physical output and efficiency of physical output .

Adding a resistive load provides an overload of the force component [5, 6]. RSS training acutely provides the athlete with less braking forces, [7-9] longer opportunity for greater forward trunk lean and, therefore, a better chance for horizontal application of force [7, 10-13]. Although athletes spend longer on the ground when sled sprinting, this provides more time to develop their ability to produce propulsive (or horizontal) forces [9, 10]

A recent review found 10 from 11 peer-reviewed studies observed RSS training improvements in either acceleration or maximal velocity sprint performance [14]. In sprint and strength-trained rugby players, 12 sessions of 3×20 m of RSS at a 12.6%BM sled load combined with 3×20 m of URS was enough to provide improvements in speed performance beyond 6×20 m of URS training alone [15]. The review also discounted the ‘heavy sleds make you slow’ myth. Sled loads from 12-43%BM were effective in the improvement of sprint performance.

Although RSS training is an effective method for improvements in sprint performance, the review deemed it unlikely to be more effective than unresisted sprint (URS) training [14]. However, many of the studies kept sled load rather light. Part 2 of this article will discuss RSS load and the potential adaptations from different loads. Secondly, RSS training may provide different neuromuscular and biomechanical adaptations to URS training alone.

Slow Down

But…we have a problem. We do not even have a grasp on the absolute fundamentals of resisted sprint training. We’re not even sure how to load the sled.

Our current situation reminds me of NASA’s Mars Polar Lander of which crashed as two separate teams were antagonistically working in imperial and metric units (I’m certainly not comparing sport science to rocket science – we’re obviously a lot smarter with our finances). Authors have utilized three different methods of sled load prescription used in peer-reviewed training studies. This is a problem. Without a uniform and agreed method of sled load prescription, we cannot begin to accurately discuss RSS volumes, intensities and training adaptations.

Absolutely Relative

Table 1 outlines the current and proposed methods of sled load prescription.

Table 1. A comparison of current resisted sled sprint loading methods.
Method Characteristics Limitations
Absolute load (kg) Simple Does not account for body mass, sprint speed characteristics.
Unlikely to provide targeted or uniform training stimulus across group of athletes.
Percentage of body mass (%BM) Simple, requires athlete weigh-in only.
Accounts for athlete body mass.
Does not account for force, power or sprint speed characteristics.
Unlikely to provide targeted or uniform training stimulus across group of athletes.
%Vdec (decrement in unresisted sprint velocity) Accounts for differences in sprint performance.
Likely to provide targeted or uniform training stimulus across group of athletes.
Results from studies can be generalised to practice regardless of sled or surface type.
Can be used with other measureable resisted sprint methods e.g. Run Rocket or Exer-Genie.
Requires pre-testing with speed gates.
No ‘maximal’ value means opportunity to periodise RSS loads is unlikely.
%MRSL (maximal resisted sled load) [16] Accounts for differences in sprint acceleration performance.
Likely to provide targeted or uniform training stimulus across group of athletes.
‘Maximal’ value provides opportunity for periodisation of RSS loads
Results from studies can be generalised to practice regardless of sled or surface type.
Can be used with other measureable resisted sprint methods e.g. Run Rocket or Exer-Genie.
Requires pre-testing with speed gates, of which can hold time-constraints with large groups.


I do not prescribe an absolute load (e.g. 10kg) or a load relative to athlete body mass (%BM). I would not ask a squad of 15 rugby players to each back squat 100kg, or hang clean 50% of their bodyweight. Why generalize these methods to RSS training? Body mass is rarely a determinant of sprint performance. Furthermore, RSS performance is related to individual force, power and sprint characteristics [16]. RSS programs prescribed with either absolute or %BM methods mean the coach is providing a non-uniform or unknown training stimulus among athletes (Figure 2). Alternative approaches are required.

Percent Body Mass for Resisted Sled Load Training

Figure 2. A common scenario with the %BM method for resisted sled load training.


Alternative loading strategies must account for an athlete’s resisted sprint velocity or acceleration ability. Table 1 outlines the benefits and limitations of two alternative resisted sprint loading methods: %Vdec (decrement in unresisted sprint velocity) and %MRSL (maximal resisted sprint load).

Measurement of %Vdec is simple (Table 2) and application of this method has been used in various training studies [11, 17-21]. This method has much potential for use in applied settings. It accounts for both unresisted and resisted sprint velocity. Therefore, %Vdec accounts for the technical demands of resisted sprinting (e.g. greater trunk angle, changes in force production, changes in force application).

Table 2. Simple method for %Vdec testing.
Steps
1 Decide upon RSS training distance (say, 20m).
2 Test and record time/velocity for 20m URS trials.
3 Test and record time/ velocity for 20m RSS trials with a range of resisted loads.
4 Decide upon the % decrement in time/ velocity you wish train at – prescribe corresponding sled load.


MRSL was originally developed by Martinez-Valencia, Pedro Alcaraz and their research group [16]. MRSL is somewhat of a misnomer. MRSL does not indicate the heaviest load before an athlete can physically move the sled. In this respect, it is not analogous to a traditional one repetition maximum (1RM).

The MRSL method is illustrated in Table 3 and Figure 3. Simply, MRSL is the “maximal load at which the athlete remains in sprint acceleration from 10 to 20 m in a 0-20 m resisted sled sprint”. For lovers of diagrams, Figure 4 further illustrates the description of MRSL. As we increase sled load, the rate of acceleration between 10 and 20m decreases. Eventually, sled load increases to the point where the athlete is decelerating, i.e. we have trialed beyond the maximal load to maintain acceleration.

Table 3. Simple method for MRSL testing.
Steps
1 Test and record times for 20m RSS trials. Record 10-15m (section A) and 15-20 m (section B) velocity. See diagram below.
2 If velocity of section A < section B, the athlete is accelerating. Perform next trial with heavier load (e.g. 5%BM).
3 If velocity of section A > section B, the athlete is decelerating. The corresponding load has surpassed MRSL.
4 Decide upon the %MRSL you wish train at – prescribe corresponding sled load.


MRSL Sled Training

Figure 3. MRSL diagram adapted from Martinez-Valencia et al. [16]


Relationship between sled load and acceleration of MRSL.

Figure 4. Theoretical illustration of the relationship between sled load and acceleration of MRSL.

Although not identical, the idea of MRSL is not too far removed from the 1RM method of standard weight-lifting loading protocols. The MRSL test provides the practitioner with a single value. This value can act as a ‘maximal load’. Based on a ‘maximal load’, RSS loads can be programmed and based on the adaptation required by the practitioner. Part 2 of this article will expand on RSS programming using the MRSL method.

In-house research at UCD High Performance has shown MRSL to be a reliable method that significantly correlates with performance tests such as 0-10 m speed, 0-20 m speed, vertical and horizontal countermovement jump, horizontal bounding and loaded jump squats. Therefore, the test is certainly superior to the %BM or absolute load methods. MRSL loads were measured at between 22-50%BM for females and 30-65%BM for males. The top-end numbers are quite heavy, yes.

Figures 5-1 through 5-5 illustrate how heavier sleds induce greater forward trunk lean and, therefore, increase the likelihood of greater horizontal force application.

Trunk angle during resisted sled training

Figure 5-1.

Trunk angle during resisted sled training.

Figure 5-2.

Trunk angle during resisted sled training.

Figure 5-3.

Trunk angle during resisted sled training.

Figure 5-4.

Trunk angle during resisted sled training.

Figure 5-4.

Provided the athlete is accelerating, the trunk lean during a resisted sprint will be specific to, or greater than, the trunk lean at a certain portion of URS acceleration, i.e. trunk lean over 20 m at 100%MRSL and that of very early URS acceleration. Therefore, training with loads close to MRSL may provide the athlete with increased exposure/ practice at the trunk angle experienced in early acceleration. More practice = a greater chance of developing a more favorable motor pattern or positive change in acceleration technique that enhances greater horizontal force application.

The practical application of MRSL will be discussed in Part 2 of this article.

Summary

  • RSS training is an effect tool for improvements in sprint performance. Adaptations are likely related to improved horizontal application of force. However, we are yet unsure of how to prescribe sled load.
  • Absolute or % BM sled load prescription methods do not account for sprint or acceleration performance. It is unlikely these methods provide a uniform stimulus between athletes.
  • The %Vdec is a simple and relative method of resisted sled load prescription. This method accounts for between-athlete differences in sprint performance and resisted sled sprint mechanics. However, this method does not inform the coach of a ‘maximal’ load or a measure of acceleration quality.
  • The MRSL method is superior in terms of providing an understanding of the relationship between sled load and the trunk angles obtained during specific URS phases.

Pinch of Salt

This piece of work is established from a combination of research evidence, opinion and most importantly, training/ coaching experience. I still have much to discover, and I invite critique, questions, and discussion. There will be many out there who have alternative opinions and experiences please share.

All papers mentioned in this article can be found here.

Acknowledgements

I wish to thank Dr Brendan Egan, Dr Eamonn Flanagan and Stuart McMillan for their excellent comments in the revision of this article.

Please share so others may benefit.


References

  1. Morin JB, Bourdin M, Edouard P et al. Mechanical determinants of 100-m sprint running performance. Eur J Appl Physiol. 2012;112(11):3921-30.
  2. Morin JB, Edouard P, Samozino P. Technical ability of force application as a determinant factor of sprint performance. Med Sci Sports Exerc. 2011;43(9):1680-8.
  3. Rabita G, Dorel S, Slawinski J et al. Sprint mechanics in world-class athletes: a new insight into the limits of human locomotion. Scand J Med Sci Sports. 2015.
  4. Young WB. Transfer of strength and power training to sports performance. Int J Sports Physiol Perform. 2006;1(2):74-83.
  5. Cottle CA, Carlson LA, Lawrence MA. Effects of sled towing on sprint starts. J Strength Cond Res. 2014;28(5):1241-5.
  6. Martínez-Valencia MA, Romero-Arenas S, Elvira JL et al. Effects of Sled Towing on Peak Force, the Rate of Force Development and Sprint Performance During the Acceleration Phase. J Hum Kinet. 2015;46(1):139-48.
  7. Cronin J, Hansen K, Kawamori N et al. Effects of weighted vests and sled towing on sprint kinematics. Sport Biomech. 2008;7(2):160-72.
  8. Lockie RG, Murphy AJ, Spinks CD. Effects of resisted sled towing on sprint kinematics in field-sport athletes. J Strength Cond Res. 2003;17(4):760-7.
  9. Nogueira M, Viriato N, Vaz M et al., editors. Dynamometric analysis of resisted sled on sprint run. ISBS-Conference Proceedings Archive; 2011.
  10. Kawamori N, Newton R, Nosaka K. Effects of weighted sled towing on ground reaction force during the acceleration phase of sprint running. J Sports Sci 2014;32(12):1139-45.
  11. Kawamori N, Newton RU, Hori N et al. Effects of weighted sled towing with heavy versus light load on sprint acceleration ability. J Strength Cond Res. 2014;28(10):2738-45.
  12. Alcaraz PE, Palao JM, Elvira JL et al. Effects of three types of resisted sprint training devices on the kinematics of sprinting at maximum velocity. J Strength Cond Res. 2008;22(3):890-7.
  13. Maulder PS, Bradshaw EJ, Keogh JW. Kinematic alterations due to different loading schemes in early acceleration sprint performance from starting blocks. J Strength Cond Res. 2008;22(6):1992-2002.
  14. Petrakos G, Morin JB, Egan B. Resisted sled sprint training to improve sprint performance: a systematic review. Sports Med. 2015.
  15. West DJ, Cunningham DJ, Bracken RM et al. Effects of resisted sprint training on acceleration in professional rugby union players. J Strength Cond Res. 2013;27(4):1014-8.
  16. Martinez-Valencia MA, Gonzalez-Rave JM, Santos-Garcia DJ et al. Interrelationships between different loads in resisted sprints, half-squat 1 RM and kinematic variables in trained athletes. Eur J Sport Sci. 2014;14 Suppl 1:S18-24.
  17. Alcaraz PE, Elvira JLL, Palao JM. Kinematic, strength, and stiffness adaptations after a short- term sled towing training in athletes. Scand J Med Sci Sports. 2014;24(2):279-90.
  18. Clark KP, Stearne DJ, Walts CT et al. The longitudinal effects of resisted sprint training using weighted sleds vs. weighted vests. J Strength Cond Res. 2010;24(12):3287-95.
  19. Lockie RG, Murphy AJ, Schultz AB et al. The effects of different speed training protocols on sprint acceleration kinematics and muscle strength and power in field sport athletes. J Strength Cond Res. 2012;26(6):1539-50.
  20. Makaruk B, Sozanski H, Makaruk H et al. The effects of resisted sprint training on speed performance in women. Hum Mov. 2013;14(2):116-22.
  21. Spinks CD, Murphy AJ, Spinks WL et al. The effects of resisted sprint training on acceleration performance and kinematics in soccer, rugby union, and Australian football players. J Strength Cond Res. 2007;21(1):77-85.

The post Resisted Sled Sprint Training – Part 1 – Methods of Sled Load Prescription appeared first on Freelap USA.

1080 Sprint Review at Xceleration Sports Performance Labs

$
0
0


1080 Sprint on the Track

By Matthew Neel, Xceleration Sports Performance Labs

Xceleration Sports Performance Labs in Austin, Texas was among the first sites in the US to acquire a 1080 Sprint to evaluate and improve athlete sprint performance. Matthew Neel explains the benefits of the system for speed training.


Xceleration Sports Performance Labs Founder Matthew Neel explains the benefits of the 1080 Sprint.

Transcript

We spent nineteen years developing the most comprehensive speed training program, and in those nineteen years we have never come across something as game changing as the 1080 Sprint.

Our whole business is based on finding what limits an athlete’s speed and finding as many limiting factors as possible and doing everything we can to correct them. The 1080 Sprint allows us to see those things instantaneously. We can see whether it’s a force production problem, whether it is a turnover problem, or whether it’s a peak speed issue and just their movement speed alone.

The 1080 Sprint has really allowed us to expand our teaching and coaching capabilities. The instant feedback and the ability to give cues that we were never able to give before has really been one of the greatest advantages of the 1080 Sprint in our facility.

The ability to not just measure and see what an athlete’s made of, but actually being able to give them real-time cues and being able to change what they’re doing instantaneously as they feel it and see it visually coming back to the screen and looking at it has been a great asset to us.


The 1080 Sprint has allowed us to expand our teaching and coaching capabilities. - Matthew Neel
Click To Tweet


For instance, when we are training athletes to run a faster 40-yard dash, we need to see exactly when they are reaching their peak speed, how much power they are producing and where they produce that power. We also like to see how long they’re producing that power. And if we can look inside an athlete’s 40-yard sprint and start to break it down and start to tear apart things and look at, well, they may have hit their peak speed at ten yards, and we need them to hit it at twelve yards, for instance. Or they can only hold their top speed for two or three meters, then we know exactly what area we need to train and develop.

The information that you get back from a 1080 Sprint test is going to give you more data that is applicable to a specific sport of specific position, more comparable than any data that you are going to receive out of typical combine test that we use currently. And used in conjunction with it’s a great tool to look inside that athlete and see what level they can actually play or perform.

Please share so others may benefit.


1080 Sprint Leaderboard

The post 1080 Sprint Review at Xceleration Sports Performance Labs appeared first on Freelap USA.

High School Football Spring Training Test Results

$
0
0


Football Spring Training

By Chris Korfist

Earlier this year, I was given the opportunity to work with a football team, something that I haven’t done in over a decade. It was time to “put my money where my mouth is.” Coaching a football team is a much different task than coaching a track team, which I am still doing at a different school. Running an “off-season” football program makes my job more difficult because I have other issues to deal with, like athletes who are currently playing other sports and dabbling with what we are doing, athletes who just don’t show very often or even the athlete who continues to do what they want. And, I have to make the variety of people who participate happy. I need the gym rat and bench press champion to buy in as well as coaches who argue that the vertical jump and 40-yard dash are worthless tools to assess football. They argue, “We need to be power cleaning!” And in the next sentence say that moving the bar fast has no application to getting stronger. Luckily, only one person writes the check, and that is the one that I needed to make happy. His goal was singular, speed. Here is what we got.

My football group starts at 5:50 AM and goes until 7:10. We start the morning with group breathing in a power stance and go to activation. Our morning warmup either consists of the Cal Dietz warmup or classic GPP for 6 minutes. We are a signal based offense, so the coach signals to the players what exercise he wants, and the players have to react. The coach’s goal is to get a play off every 12 seconds, so that is our length per exercise. We look for immediate changes in the exercise.

From there we break into three groups. Our lifting is Cal Dietz’s Triphasic training with some minor changes to incorporate into the workout. One of the big changes is that I need to do weight room stuff because it is football and not to lift for football would be sacrilegious. But we get two days of running in. One is a fly 10 using our Freelap system, and the other is a start day. Originally I had hoped to do block times but ended up spending all of my time working on starting technique. This setup was convenient because the indoor track is connected to the weight room, and we can easily make the transition from the weight room to the track.

Tri Phasic Training

Once we shifted to the spring, we could focus more on football. Spring sports moved outside, and that gave us free reign of the field house, save the day of health fair where the PE department needed the weight room for a hospitality room and AP exams taking the 4th court. Our warm-up became agility work, where we worked squares, circles and T’s. Our weight room work shifted to phase 2 of the triphasic workout that consists of lighter loads and focusing on bar speed. And sprinting shifted to working on a 40. We broke the 40 into different segments and timed them with our Freelap. We started with a couple of weeks of fly and block 10yds but gradually spread out so the distance would be 40yds over the next four weeks. So a fly 20 and block 20 could be used for an athlete to add their times and figure what their perfect 40 would be.

Our “bumps” were, of course, Chicago weather. School can get canceled for snow or cold, weather is so bad that athletes don’t show, or spring sports move inside and have priority over out of season clubs (per our state rules). Additionally, we have athletes that have spotty attendance. We have athletes who do too much and in addition to their training will do multiple workouts with 7 on 7 passing clubs. This is not to mention the athletes who also are playing another sport while trying to train. Or, we have athletes that selectively train and pick what they want to do, like skip running and just sit in the weight room. The ones that kill my numbers are the ones who just didn’t feel like testing, so I get a goose egg for my numbers. I love the law of averages.

Some observations that I can make from the results are as followed:

  • The athletes who refused to sprint or work on starts did not improve in their fly times. They did get stronger in the weight room, but fly times did not improve, and 40 times decreased. In some cases, we had athletes that ran a fly 10 as much as 0.10 seconds slower and also had a slower 40 by as much as well.
  • Our track team prides itself on squatting heavy three days a week and does traditional long to short workout. The athletes that we shared had a drastic decrease in performance in the Vertical jump, fly 10 and 40-yard dash, meaning they just got slower and didn’t jump as high. We had some athletes in that group who couldn’t do a final test due to injury.
  • Strangely enough, the athletes that ran their fly 10’s weekly and worked their starts in addition to their lifting had the greatest improvements. In some cases, we had improvements by as much as 0.2 in their fly 10 and a drop in time by .48 in their 40. Our best VJ performance was 5.3 inches from the first training block.
  • I could not use pro agility times because they were not electronically timed. Different people hand-timed them but by doing daily agility drills, the athletes improved greatly.

On the whole, when factoring the good and the bad, we had some substantial improvements for the 90 athletes that we have show up. From the first block of 8 weeks, the average vertical improvement was 2.35 inches. The average improvement for the fly 10 was 0.12. When it is all said and done, we had some good team improvements. Again, everything was electronically timed, Just Jump pad and Freelap. As a team, our 40’s improved by an average of .314. Our vertical jump improved by 3.35 inches and our bench press average improvement was 28.8 lbs.

The test results can be downloaded here.

When I shared the results with Cal Dietz, strength coach of University of Minnesota and owner of XLAthlete.com, he was impressed. We decided to collaborate and put together a manual that coach or players can use and hopefully replicate the same results. This is a rare example of a manual that works on what football teams need to win, speed. The website for the manual is here.

Please share so others may benefit.


The post High School Football Spring Training Test Results appeared first on Freelap USA.


6 Steps to Reduce and Rehabilitate Hamstring Injuries Like a Pro

$
0
0


Soccer Player Hamstring Injury

By Carl Valle

If you are a betting person like me, you will wager on the likelihood of hamstring injuries. Our goal is to change the odds, not eliminate them unless you don’t plan on sprinting at high speeds. This article will cover mechanical tears in the hamstring muscle group, not talk about “cramps.” Research is clear that cramping is not always related to preparation of the body for sport.

I will outline a way to reduce injuries and a smarter way to rehabilitate them if things go south. I have had the luxury of working with some of the best minds and talents in professional sport, so will discuss both clinical research and best practices. The text will show proven fresh ideas that are far more efficient and effective than old methods that should be put to rest.

Who Can Use These Guidelines?

Any professional in sport can use these guidelines, not just elite coaches. I have coached at all three levels (high school, college, and pro) and seen first-hand what doesn’t work and what does. For the sake of transparency, I will name experts and show why a process works for some and but perhaps not for everyone. So if you have a responsibility to a team or are an athlete coming back from a pull, this outline will be worth your time and something worth printing out. I urge you to seek aggressively what is best and refine this step-by-step process as the structure is sound and the details can always be fine-tuned.

One

Screen Medical and Training History

Most coaches inherit their athletes so that you could be handed a ticking time bomb. When a coach inherits damaged goods, their success rates plummet, even if they are great at what they do. Having excellent medical records is the first and most important step because you can’t go back in time and unknown information poisons good training systems. My suggestion is to use your own AMS system to control your destiny. Even if it’s paper, the key is the access and integrity of the data, not the cool UX or testimonials of hospitals.

You also need an athlete’s training history. Why coaches don’t care about legacy training data is an enigma to me. Patterns of training in the past usually provide clues as to why people get hurt in the future. So much can be learned from training records. Even great programs are humbled when bad programs ship their problems to them. Change to an improved situation takes time and is analogous to deprogramming people from cults.

The best way to screen people for past injury history and training background is a written report followed by a face-to-face review. Sometimes past records exist and can be forwarded, making the process simpler. Still, records—no matter how sophisticated the software and technology—need human input. Also, any lack of data is useful information to coaches as well, showing poor procedural issues and past internal problems with injury cultures.

The first step is using a simple form to cover the years of living from cradle (genetic testing will make things more interesting) to current status. I use “living” as many athletes get injured outside of sport, so questions must be exhaustive and not too narrow. Also, it is important to name names with medical professionals and milestones. Those include information about actual diagnoses and whether or not an athlete completed therapy. So many times I see records of symptoms but no data or diagnosis.

Also creating frustration, many athletes stop rehab because the season ended, not because they finished treatment. Medical imaging has value, but the research also points out that it’s part of the diagnosis and not the end guide. Many pain bloggers talk about radiology not representing function, but not too many avulsions work out in sport and with the number of pain drugs people are on, this process is messy.

A wise approach is seeing a combination of pain, functional outcomes, and radiology. Some athletes have phantom pain from chronic injury; some have major impairments from undiagnosed biomaterial destruction (fractures and massive tearing) that go undiagnosed. The body can heal itself but sometimes needs help. Don’t let symptoms and radiology rule, but don’t ignore them and just do “movement.” Some trauma can be life-changing. I have seen major nerve damage that ruined careers because therapists didn’t listen to athletes.

Following up with records is talking and asking for recollections. I get more out of this because athletes hate filling out reports. I don’t want people skipping steps and just reviewing together because bias slips and the contrast of what is reported and what is teased out is a great way to profile compliance with monitoring and reporting. Finally, talking about past training is a good way to learn what athletes like and how they view preparing for sport. Skipping this step is a mistake in the long run.

Training and Injury

Figure 1. When injuries occur, training suffers and a vicious cycle of re-injury usually follows. What is important is being creative to work around injuries so poor conditioning and loss of eccentric power is preserved.


Two

Test Muscle Length, Strength, and Readiness

The hamstring group is three muscles connected into one system, and each has individual responsibilities. My favorite question to ask athletes after they say they pulled a hamstring is “which one?” The answer is almost always the right or left leg, rather than which actual hamstring was injured. It is also important to know the degree of damage. I have seen crazy injuries and ones that were false alarms, and imaging helps identify past problems and current ones. Radiological findings don’t show successful outcomes in the literature and are a poor predictor of return to play.

VALD NordBord Hamstring Tester

Figure 2. The NordBord reflects aggressive yet sane training in the weight room. I have seen an amazing correlation between the eccentric utilization ratio and hamstring strength and tissue length using the kBox and conventional methods.


I have seen repeated imaging of scar tissue remodeling rapidly from aggressive eccentric work and manual therapy. Manual therapy doesn’t break down scar tissue, but mobilization does allow changes so guarding is lost and confidence is increased. I never use the word placebo, because I have seen Tensiomyography and Elastography changes from manual therapy. But the scar only changes when massive eccentric loads tear and replace the tissue. Most of the time a tear is going to leave some small scarring, but the idea that it’s in there forever is just a belief because very few people train hard after an injury to remodel tissue. Time helps to heal, but the scars are still there.

Hamstring testing can be done with different diagnostic tools, and the most promising is the NordBord. I am not a big fan of Nordics as an exercise but found the research on hamstring length (fascicle) and strength to be straight to the point. Ultrasound can measure length and risk can be measured based on the clinical research. Strength to the specific hamstring muscle groups can be measured as well, and the data can show who has been naughty in the offseason and who has been nice (training properly). Other training indices can feed into the hamstring strength score, and asymmetry can be extracted with athletes who are healthy or have had past issues.

Biceps Femoris

Figure 3. Tensiomyography and other screening tools are starting to slowly gain momentum in elite sport. Much of the reason for such interest is the failure of current practices in showing better outcomes.


Myoanalytics, an important area, coined and expanded by performance and medical consultant Jose Fernandez, is a fantastic way to see current readiness of muscle. Tensiomyograpy, Elastography, and Myotonometry can help address acute changes from day to day or even session to session within the day. The most perplexing area of sports medicine is muscle monitoring since injury reports cite tissue or joint indicators. Yet everyone seems to be measuring more distal indices like autonomic fatigue versus site-specific changes. College and pro teams must focus on myoanalytics or miss another level of early detection.

Three

Assess Locomotion Techniques

Simple video analysis can detect possible biomechanical errors that increase risk. Many manual therapists don’t see someone move, but those who do have an extreme confirmation bias that makes me want to pull what’s left of my hair. So many times I have seen athletes get off the table with a placebo therapy and say the most mind-blowing responses that feed into the therapist. If a tablet or iPhone is used for pathomechanics evidence, or live demos are used as examples, run the other way. The evidence is measurable and repeatable, and many adjustments and rubs don’t change anything. Sometimes therapy can be seen with EMG. The fine wire stuff is harder to find because sticking needles into small muscle groups isn’t popular with elite athletes, so buy your own equipment. I would rather see more fine wire EMG units than “dry needling” because of the need to get meaningful data.

The most common issue I see is the landing mechanics of high-speed efforts by soccer players. Bad footstrikes pollute the world’s most popular game. Look at major teams and scout the heel striking first during early acceleration. One would think that this is bogus, but it happens for many different reasons. Make sure basic acceleration and top-speed mechanics are exposed to veterans, reinforced by academies, and safeguarded in PE or youth programs.

During high-speed activities, athletes pull at higher forces and velocities. So movement screens are rarely valuable but do have some merit if scored properly. Footstrike and recovery mechanics expose athletes to either fast deceleration eccentric open forces (swing phase) or rapid acceleration of eccentric load during the closed mid-stance phase. During Repeat Sprint Ability tests and long sprint testing get video and break down running mechanics. Not much can be done for the most part, but some changes are possible even late in careers. Here are some useful key performance indicators during video review.

Pelvic position – Some attacks on posture are right since posture is not a ticket to injury. Those who say it doesn’t have any relationship live in a world in which wellness walks with the dog and grocery shopping are the challenges their patients face. Sport is not the same since the demands are unique. Working with occupational therapy is also different than sport. I don’t expect to have sports medicine walk in and transition without learning, so each population must be treated slightly differently.

Noraxom MyoMotion ROM

Figure 4. Lab quality surface EMG is a practical option when coaches use it during sport activities to evaluate firing patterns. Since interpretation requires a lot time, simple approaches like testing key performance movements can dramatically decrease time and confusion.


We are looking for no changes in inclination from technique errors or preparation. An athlete having lordosis from vertebral architecture will not change because of a PRI session. On the other hand, restoration of some guarding can get athletes out of compensatory patterns that are not mechanically advantageous. I have never seen a legion of world-class Olympic weightlifters with bad kyphosis, but having great posture isn’t going to prevent elbow injuries in the MLB.

A fair and middle-ground area is making sure training doesn’t ruin posture. Many bad training sessions can cause errors that change body alignment to unfavorable positions. The pelvis should tilt back and forth and form a figure-eight pattern during upright running and have less motion during early acceleration. Look for excessive movement or restriction, not locked positions. If athletes have high-knee position at high speed, their pelvises aren’t restricting them.

Arm and leg synchronization – Dan Pfaff has explained arm and leg relationships for years. Arm action usually either poisons lower body kinematics or identifies dysfunctional changes. Very few videos have the image quality to show precisely what is going on with kinematics. Also, force analysis in racing is not happening with current track and shoe technology, so practices and some limited race footage are all we have and. The arms and legs stay together with regards to timing for balancing things out. Instead of butchering things I suggest an Altis coaching education week in Phoenix.

Landing and propulsion mechanics – Footstrike is a growing area of data way beyond the scope of this article, but high-speed film and modern pressure mapping are evolving to decode the Rosetta Stone of anatomy, forces, and muscular recruitment. Not too far down the road, workshops that connect foot mechanics and motion with training and therapy will be more accessible.

Four

Profile Speed and Conditioning

The cost of doing business with both effort and work with athletes is important to know—which means testing speed and stamina. Absolute speed testing looks at what an athlete can do, and conditioning tests look at what the athlete can repeat and sustain. Without knowing basic aerobic fitness and speed, many athletes with great resilience qualities from weight training and running technique simply get trashed. No matter how great the weight training, offseason preparation, manual therapy, and diet, any athlete can get ruined by team coaches and bad calendars that don’t gel with their fatigue and recovery. When one is trying to keep an athlete healthy, being in shape (aerobic) and knowing how hard (player load tracking) becomes a classic case of cultivating rest and knowing when to push.

Plenty of resources exist on modeling seasons, monitoring fatigue, and managing power. Anyone can, at least, use subjective data as simple online and mobile tools like Survey Monkey are free. A lot of work is being done on predictive modeling and risk analysis. Some formulas are better than others. I suggest looking at the Australian models for reducing non-contact soft tissue injuries and using an American approach that is more efficient and more engaging for sports that don’t have the wonderful culture of rugby.

Speed Profiling

Figure 5. Test all of the speed, power, and conditioning qualities to see how athletes change. A lot of tables exist in the community on athletic development, but the key takeaway is to see how individuals change as a sign of risk or responsibility if they are improving.


Five

Evaluate Hamstring Injury and Plan R2P

To deal with injuries, the first step is working with a sports medicine staff and having a plan ready. The most important part of this process is identifying the severity and location of the injury with imaging, and focusing on tolerance and symptoms with the human side. I have written my mantras on injuries, so I will not dig into the patient process about training and finishing the rehabilitation. Here are some common mistakes.

R2P based on calendar – I always see injuries happen in team sport in the US. When the injury is confirmed, a 6–8 week (or similar) time frame to return is shared. The problem is that healing times or rates and when someone can compete are not synonymous. Jack Youngblood, a Hall of Fame football player who taped up a fractured fibula to play, isn’t an example we can use for milestones in sports medicine. MRI findings are not successful for a successful return, so tissue readiness may be better suited to myoanalytics and functional norms.

R2P based on pain – Because pain science is a touchy subject, I will not get too deep with symptoms and readiness to play. What is one politically supposed to do with athletes and symptoms? My experience is that mental and physical feedback from the ability to do something meaningful, and the qualities that got them great returning to baseline, is a solid approach. With pain medications and most modalities focusing on removing pain, I don’t work with anyone unless they can warm up without referred problems. I need a mental status that is not weighed down with baggage.

R2P without milestones and benchmarks – I have shared definitions of what is included in a good R2P program, but the best ones are very explicit in criteria. The milestones are not steps on a staircase; they are small wins or achievements that show enough delineation to say one has hit a major indicator of change. The best resources are likely from advanced ACL programs by experts like Bill Knowles.

Hamstring Protocol

Figure 6. The above algorithm includes a possible roadmap for successful R2P if each step is broken down to very specific protocols. I highly recommend each injury have a decision making tree to help guide professionals and audit the process more.


Another example of a hamstring R2P algorithm is here and got criticized by noted hamstring injury expert Dr. Shield. Algorithms should be public as no secret recipe exists so they can be refined and improved.

Shield-Quote-Hamstring

Note this is for grade 2-3 and not for something slight as cryotherapy can retard healing. The current literature points out that cryotherapy isn’t as effective as it once was. In only a few cases does it make sense to ice, and even in those instances, arguments can be made against using it. Very little research can investigate actual muscle tears since histology is invasive and inducing tears is not an accepted design study ethically! I don’t currently ice after day two myself, but the theory is that the edema will be more problematic over the next week than the delay of repair. Will we see a future of no cryotherapy in the next ten years? I don’t know.

Six

Follow the R2P Algorithm and Repeat the Process

The process of preparing is never-ending. Each year screening and testing will be done, and after injury, the sequence repeats. Each year review the protocols and procedures and fine-tune the process by becoming more efficient. Hopefully keeping up with the research will keep it more effective. Little things that make a difference are areas that are not sexy, such as making sure a laptop for the myoanalytics device is updated or notes on athlete feedback are recorded to the AMS platform.

My most important suggestion is following the R2P algorithm, so pressures to play don’t overwhelm the support staff. I love contracts and constitutions, meaning focusing on writing the heart of the program into a document instead of making it a personal decision. Everyone has negotiation skills to skip steps and freelance with practice. Recently a sports medicine professional added a practice component not agreed on earlier, making it a reactive scramble versus a well-oiled machine. If you want to make a change, at least, run it by everyone first before going rogue.

Rehabilitation is a dark art. While the sports medicine process is modern and much more evidence-based, we are still not much different than a century ago. Much of sports medicine is about loading and adaptation, and coaches and sports medicine professionals need to orchestrate the elements, not act like oil and water.

Closing Thought on Hamstring Injuries

It’s humbling to the ego and never fun dealing with hamstring injuries. While we can reduce them by using sound principles, the need for entertainment schedules and money aren’t increasing the results with the athletic population. The outline I have shared is not perfect, but it’s a great framework that is flexible and sound enough be modified by anyone seeking better outcomes.

Please share so others may benefit.


The post 6 Steps to Reduce and Rehabilitate Hamstring Injuries Like a Pro appeared first on Freelap USA.

A Historical Progression of Sprinting Top Speed World Bests

$
0
0


Greek Runners

By Pierre-Jean Vazel

This is the first time an historical progression of the highest speed ever recorded is published. Using bibliographical sources, including some unreleased data, it gives an account of the scientific challenge to record the human locomotion. Top speed is the parameter of the sprint races that is the most correlated with the final result, yet it has been the least investigated one. Indeed, for decades, science researchers have focused either on the start through biomechanical analysis or speed endurance with physiological studies, mainly for two reasons: top speed was thought to be not much trainable, and it is technically difficult to measure. Nowadays, it has become a centre of attention for coaches, media and fans.

“The top speed is seldom obtained until 40 yards,” wrote Ed James about sprinting in his Practical Training in 1877. But it took about 50 years before this top speed received enough attention to get quantified in flying runs or race breakdowns using either manual or electric timing. However, during the XXth century, it was hard enough to have an undisputable official timing of the races, let alone accurate measurements of the top speeds attained by the sprinters.

The first estimation of human’s top speed dates back to 1886 in Étienne-Jules Marey’s work as reported in the Weekly Reports of the Science Academy’s sessions: “The speed of progression increases indefinitely with the rapidity of cadence, and tends towards limits that seem to be around 10 meters per second.” The following recorded speeds mix biomechanical reports and more casual results, which sometimes lack precision and accuracy, especially the hand time splits which can be ‘too good to be true’, but I still chose to present them in respect to their historical significance.

10.27 Meters Per Second

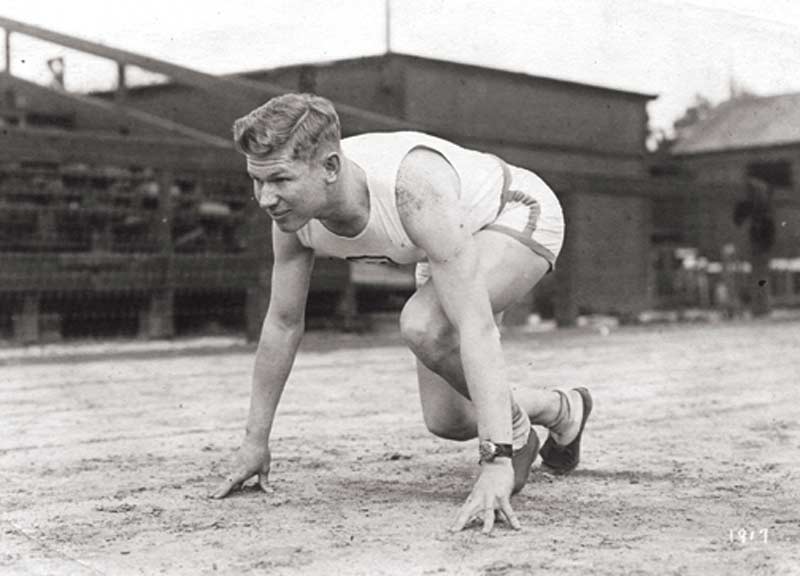
Charles Paddock (USA) Berkeley 31.03.1923

Hand timed in 8.9 for 100 yards from flying start (25 yards run-up). The 1920 Olympic champion at 100m ran the 100 yards in 9 4/5, just missing the then-World Record (9 3/5), and then decided to be timed in 100 yards from flying start, and also won the 220 yards by 10 yards in 21 1/5. Source: Berkeley Daily Gazette, 02.04.1923.

Paddock may have run faster for a shorter segment of races: he was officially hand-timed in 8 4/5 at 90 yards and 9 3/5 at 100 yards during an 110 yards race in 10 1/5 in Pasadena on 18 June 1926, beating or equalling World Bests. The 0.6 second time for the fastest 10 yards segment is an impossible 15,24 m/s and the 20 yards segment in 1.4 translates to a 13,06 m/s speed that is not reliable either. But given that the accuracy of hand timing back then was only 1/5 of a second, no credit can be given to such measurements. A time of 1.7 for 20 yards, hence 10.76 m/s would be closer to Paddock’s actual sprinting abilities.

Charles Paddock

Charles Paddock


10.48 Meters Per Second

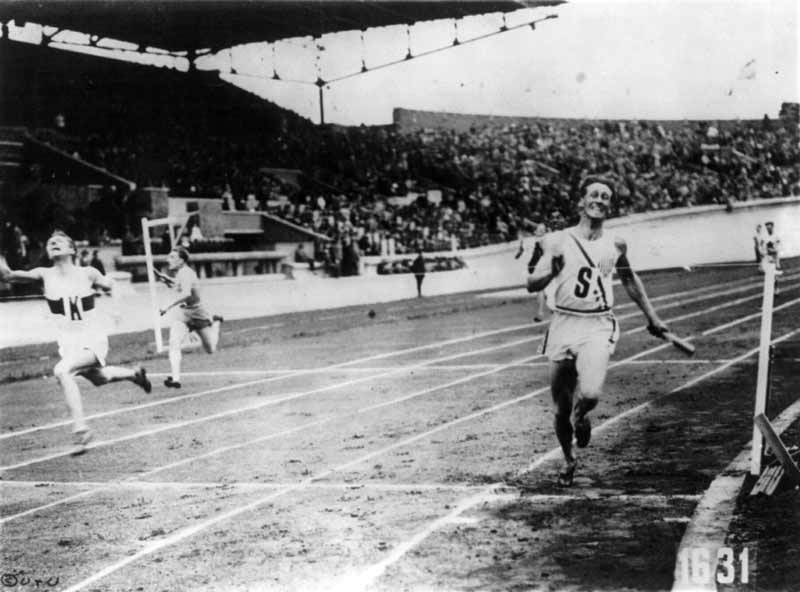
Henry Russel (USA) Ithaca, NY Spring 1927

Electronically timed in 1.745 for 20 yards interval during a 200 yards race (straight lane) in 19.455. Coils of wire were arranged parallel to the track connected to a galvanometer and were placed at distances from the start of 1, 3, 6, 10, 15, 20, 40, 60, 80, 100, 120, 140, 160, 180 and 200 yards. The passage of a thin steel magnet on the runner’s jersey induced a current in the coil recorded by the galvanometer and printed on a moving photographic paper. The experiments were made with local sprinters at the Schoellkopf Field straight track at Ithaca’s campus, as part of Dr. Archibald Vivian Hill’s series of a lectureship in chemistry at Cornell University from February to June 1927. Hill received the Nobel Price in Physiology or Medicine in 1922 for “his discovery relating to the production of heat in the muscle”. Source: Furusawa et al. The dynamics of sprint running, 1928. “Hank” Russell’s personal bests stood as 9.7 at 100 y (1926), 10.7e at 100 m (1928), 21.5 at 220 y and 21.4 for the straight course (1926) and he became Olympic champion at 4×100 m and reached the 100m semi-final at 1928 Games. Coincidentally, the 100m winner Percy WILLIAMS (CAN) was the subject of a similar experiment by Dr. Charles Best in an indoor track in Toronto, and the sprinter, wearing short spikes, reached 10.44 m/s as he was timed in 0.438 for a 5 yards section during a 65 yards race in 7.00.

Henry Russel

Henry Russel


10.88 Meters Per Second

Cyrus Leland (USA) Forth Worth 20.05.1930

Timed in 8.4 for 100 yards from a flying start, according to an electrical device. No details were given about how this apparatus was operating, but stopwatches caught him at 8.7, which improved the World Best set by Paddock anyway. The 8.7 figure translates to a 10.51 m/s. Source: Pampa Daily News, 21.05.1930. Texas Christian University’s Leland set the fastest 100 y time of the year in 9.4w and ran 9.6 for 101 y on 29 March in Dallas as he was set back one y for a false start! That cost him about a tenth when the World Record was 9.5. Leland already matched this time in 1929 at the TCU – Baylor match, but the record was not ratified as dual meets were not eligible for permanent listing.

11.66 Meters Per Second

Ralph Metcalfe (USA) 1932-33

During a 100 m race after 70 m. Fastest speed found in the literature by Prof. Otto Misangyi, former national coach for Hungary and Switzerland, head of the jury of time-keeps at 1932 and 1936 Olympic games. But no further detail or reference is given. Source: Misangyi O. Reaction time and speed measurement in sprint and hurdle races, Magglingen, 1956.

Metcalfe placed 2nd at 1932 Olympics, 5 cm behind the winner Eddie Tolan. Tolan was timed in 10.3 by the three official hand timers, but oddly enough, Metcalfe got 10.3 on all three… The Official Report of the games also gives other times for the race: 10.21 by the “hand electrical” method (started by an attachment on the starter’s gun and stopped by hand at the time the runners hit the tape), and 10.38 by a camera device called Kirby Two-Eyed Camera, operating at 128 frames/sec while filming runners and an electric clock started by the gun.

In his book Champion in the Making (1968), coach Payton Jordan stated that Eddie Tolan “took six strides (six feet per stride – 1.83 m) in covering the ground at the rate of 36 feet per second”, which is 10.97 m/s. This comes from an estimation by Goeffrey Dyson (Chief National Coach at the Amateur Athletic Association from 1947 to 1961) in his book The Mechanics of Athletics, London, 1962) : “Clearly, an athlete striding only 6 ft at top speed (as E. Tolan, winner of the 1932 Olympic 100 meters is reported to have done) must take as many as six strides in covering 36 ft in one second.” Tolan’s 6 feet stride length had been reported by Jesse Owens’ coach Larry Snyder in Specifications or Requirements of the new 100 meter champion, Olympic Review no. 8, 1940.

Olympic Games, Berlin, Germany, 3rd August 1936, Men’s 100 Metres Final, USA’s Jesse Owens (Extreme right) wins the race from Ralph Metcalfe (USA) and Dutchman Martinus Osendarp in a time of 10,3 seconds to equal the world record.


10.88 Meters Per Second

Jesse Owens (USA) Colombus 23.04.1935

Hand timed in 8.4 by three watches for 100 yards from flying start (20 yards run-up). The event took part 1 month before the intercollegiate meet in Ann Arbor where Owens broke 5 World Records in 45 minutes and also matched the 100 yards World Record in 9.4 as recorded by three watches. But the time could have been better: three other timers in reserve had him 9.3. Also, during that meet, times were taken as the runner’s center of gravity crossed the line, adding 0.1 to the traditional timing to the torso. Owen’s 9.4 stood 13 years as a World Record, but 9.3 would have last 26 years and 9.2, 28 years!

Olympic Games, Berlin, Germany, Men’s 100 Metres Final, USA’s legendary Jesse Owens on his way to winning one of his four gold medals.


11.10 Meters Per Second

Vladimir Volikov (URS) Kharkiv 27.07.1936

Electronically timed in 0.36 for the 4m interval between 44 and 48 m during a 100 m race in 11.15. Times were recorded to the 1/200th of a second every time the runner cuts yarns attached to poles placed every 4 m along the track. The experiments were held during the summer with several sprinters and non-sprinters. Volikov’s 100 m was one of the few whose 4m interval speeds varied during the race, with ups and downs from 24 m: 9.2, 10.4, 9.3, 9.4, 10.6, 9.5, 11.1, 9.9 m/s. It was suggested by the Simonson, the German author of the study, that those peaks are the expression of powerful motor efforts that can’t be sustained because of fatigue in the motor cortex or peripheral areas. Simonson eliminated flaws in the measurement apparatus as those peaks, when they occurred, weren’t located in the same portion of the race. However, the interval times would be affected whether the arms or the legs cut the yarns instead of the torso or hips, depending on the height of the timing system. Another explanation would be the fact that the sprinter is decelerating during the breaking phase of each step and accelerating after the push phase, as it were later recorded using spidograms and nowadays using laser devices. Source: Simonson E. Laboratory of Physiology, National Institute of physical culture of Ukraine, 1937. Little is known about Volikov as he never took part to international competition – USSR made its debut at the Olympic Games in 1952.

11.11 Meters Per Second

Harold Davis (USA) Compton 06.06.1941

Hand timed in 4.5 for the last 50 m of a 100 m race in 10.2 by his coach ‘Bud’ Winter. The 100 m time as announced officially the night of the race was 10.3, but the officials disclosed the next day that Davis actually tied the world record of 10.2 set by Owens. The three timers on duty had 10.2, 10.2 and 10.3 and the alternate had 10.4, the latest should not have been taken into account. Sources: Quercetani R. A World History of Track and Field Athletics, 1864-1964, Oxford University Press, 1964; Associated Press, Decide Davis tied world dash record, 07.06.1941.

11.33 Meters Per Second

Vladimir Sukharev (URS) Minsk 26.08.1951

Speed between 45 and 50 m during a 100 m race in 10.4 recorded using a cinematographical device taking splits every 5m. Sukharev then maintained an 11.11 m/s speed until 65m. The accuracy of the times was 0.02 s. During the same summer, he was hand timed at training for various distance from flying start: 30m in 2.7 (11,11 m/s), 40 m in 3.7 (10,81 m/s), 50 m in 4.6 (10.87 m/s), 60 m in 5.8 (10.34 m/s) and 80 m in 7.7 (10.39 m/s). Source: Chomenkov L. 100 m and 200 m races, Moscow, 1955.

12.04 Meters Per Second

Bob Hayes (USA) Atlanta 12.05.1962

Hand timed in 1.9 between 50 and 75 yards during a 100y race in 9.3 at SIAC Championships. Two years after the race, Sports Illustrated published 25y splits for that race: 3.0 at 25 yards, 2.2 between 25 and 50 yards (10.39 m/s), 1.9 between 50 and 75 yards (12.04 m/s), 2.1 in the last 25 yards (10.89 m/s). The sum of these 25 yards splits adds up to 9.2, as there was controversy regarding the final time of the race: “Among the judges, presumably atremble at the sight, there were watches stopped at 8.9 seconds and 9.0 seconds. This was impossible, of course. Nobody would ever believe such a thing. Hayes’s time rounded off to a sensational but uninflammatory 9.3 seconds.” Source: Underwood J. How fast is the fastest man alive? Sports Illustrated, 18.05.1964. The official World Record was then 9.2, held conjointly by Frank Budd (in 1961) and Harry Jerome (twice in 1962). This was one out of many World Records denied to Bob Hayes due to technical rules or dodgy timing.

In Modesto on 26.06.1962, Bob Hayes reached 11.72 m/s speed as he was hand timed in 7.8 for the last 100 yards of a 4×110 yards anchor leg. Source: Allen N. World Sports magazine, April 1963.

In Modesto on 25.05.1963, Hayes reached 11.43 m/s as we were hand timed in 8.8 for his 110 yards anchor leg. Source: Interview with Hayes in A.A.U. News, vol 34, 1963: “They tell me I ran 8.8 for 110 yards with a flying start in that Modesto race” – Report states that Hayes received the baton 10 yards behind the leader and won with a seven-yard margin. However, the accuracy of this hand timing is unknown.

In Saint-Louis on 21.05.1963 (1st semi-final of AAU Championships), Hayes was supposedly hand timed in 3.0 at 25 yards, 6.0 at 60 yards, 7.1 at 75 yards during the 100 yards in 9.1 (World Record, wind +0.85 m/s), also electronically timed in 9.40. From 25 to 60 yards, he moved at 10.67 m/s, from 60 to 75 yards 12.47 m/s (!) and from 75 to 100 yards 11.43 m/s. Source: Willoughby D. The Super-Athletes, Barnes & co., 1970. It is not clear whether these times were estimations or actual times, but as inaccurate as it can be, the speed in the 60-75 yards was used in The Guinness Book of Records for years as the fastest speed ever recorded by a human.

Various times were reported for his anchor leg during the 4x100m Olympic final Tokyo on 21 October 1964, from an 8.5 hand time to a 9.1 video estimation by Galina Turova (Legkaya Atletika 3/1965) on her technical analysis, which would be an average speed ranging from 10.99 to 11.76 m/s! From my video analysis of a Polish film and another footage with incrusted screen timing, Hayes ran 9.0e, he took the baton circa 0.15 after Dudziak/POL (10.52 in the individual event) and won by 0.30 over him. The last 40m were covered between 3.40 and 3.45 with 2.40 m step length, translating to a top speed over 11.7 m/s.

Bob Hayes became the first man to run under 10 seconds electronically with 9.91w in the semi-final of the 1964 Olympic Games in Tokyo. In the final, he ran a wind-legal 10.00 or 10.01 depending which of the 2 photo finishes you trust, a time that was corrected to 10.05 or 10.06 taking in account an estimated delay of 0.05 in the electric timing mechanisms used in the ‘60s and 10.06 became the accepted figure from the late ‘70s.

American athlete Bob Hayes (1942 – 2002) takes off from the starting blocks as he sprints for Florida A&M University (FAMU), early 1960’s.


11.95 Meters Per Second

Tommie Smith (USA) San Jose 07.05.1966

Timed in 1.53 for the last 20 yards of his 220 yards world record (19.5, wind +1.84 m/s). Source: Patinaud JC. 200 mètres & 220 yards, Temps automatiques 1932-1983. No details are given regarding the timing procedure. It’s unlikely that there was an electric timing that day, since even the official hand times of the race lack accuracy : at 200 m, the three timers had 19.4, 19.5 and 19.6, and at 220 yards (201.17 m), times were 19.5, 19.5 and 19.6, thus the 19.5 figure was accepted as a World Record for both distances! The statistic difference between 200 m and 220 yards hand times used in world lists is 0.1 and 0.12 for electric times.

His coach Bud Winter gave a measurement of Smith’ stride during the last stage of that race from the footprints on the cinder track: “At 120 yards out, Tommie’s stride measured 8’5″ (2.57 m) up to 20 yards from the finish then it increased to 8’7″ (2.62 m). In his last three strides, it measured 8’9” (2.67 m).” Source: Amateur Athlete, AAU, vol. 37 p. 70, 1966.


Video 1. Tommie Smith runs 200 meter straight.

Quoted by Time magazine (Jetting into Gear, Vol 89 Issue 10 p. 88, March 1967), Bud Winter stated that Smith was able to run at 11,64 m/s: “Other sprinters reach their top speed at 75 yds, and then decelerate,” says his coach, Lloyd (“Bud”) Winter, “Tommie is still accelerating at the end of 100 or 220 yds. He can sustain a speed of 26 m.p.h.”

Tommie Smith (right) of the USA wins the men’s 200 metres final at the Olympic Games in Mexico City, 16th October 1968. Bronze medallist John Carlos, also of the USA is on the left. Smith and Carlos later caused controvery when they gave the black power salute on the medal podium.


11.72 Meters Per Second

Valeriy Borzov (URS) München 01.09.1972

Timed in 1.56 for two consecutive 9,14 m (10 yards) intervals between 58,56 m and 76,84 m using the markers on the track for the 110 m hurdles, during the 100 m Olympic final won in 10.14 (win -0.3 m/s). Intermediate times were taken from video recordings by East German scientist Heinrich Gundlach. The report states that the error margin was +/- 0.02 s due to picture frequency; however, a second person examined the videotapes to limit the subjective factor in the allocation of times and distances. Source: Gundlach H. Olympische Leichtathletik-Wettkämpfe 1972: Dokumentation, Einschätzungen, Bildreihen, Leipzig, 1973.

Italian coach Carlo Vittori also analyzed a film of the race using the 110m hurdles markers as references, but no details are given about the frame frequency or error margin. He found that Borzov’ speed reached 11.484 m/s as he ran a 9,44 m interval between 48,83 m and 58,27 m in 0,822 s. However, these distance references don’t exist on the track and accuracy to the 0.01, let alone 0.001 s was unlikely to be obtained from a video. Source: Vittori C, Dotta GF. Analisi ritmica della finale dei 100 m. Alle olimpiadi di Monaco ’72 vinta da V. Borzov. Atleticastudi, Mar-Apr 1985.

Earlier in 1972 on 18 July, Borzov reached 11.68 m/s between 45 and 50m and 11.61 m/s between 70 and 75 m during the 100 m final of the USSR championships in 10.0 (10.28 from video timing, wind < 2.0 m/s). The method used by Pr. Dmitriy Ionov for the time analysis was very similar to the one described for Sukharev in 1951 but the precision of the time was higher. Source: Mehrikadze V. The purpose of competitive training model, Legkaya Atletika, no. 8, 1982.

11.78 Meters Per Second

Steve Williams (USA) Zürich 24.08.1977

Four strides were filmed at the 70m mark by a 16 mm Locam camera (100 fps) during a 100 m won by Williams in 10.16 (wind -1.5 m/s). Total distances and time of the four strides for the top three finishers were presented in a graph format in a scientific paper. Pr Hansruedi Kunz sent me the actual numbers and resulting speed for Williams: Stride length 2.65 m, time for four strides 0.83 (4.82 s/s). However, these figures don’t match with 11.97 m/s speed as they would result in 12.77 m/s. Unfortunately, the author has lost the original data and believes the speed is correct, and there must be a typo mistake either in the stride length or frequency. A four stride time of 0.90 (4.44 s/s) which appeared in the graph would be more accurate and would result in 11.78 m/s speed. Sources: Kunz H. Biomechanical analysis of sprinting: Decathletes versus champions, Brit. J. Sports Med. Vol. 15, No. 3, p. 177-181, 1981 and personal communication with the author.

In Minsk on 21 July 1973, Williams reached 11.63 m/s between 60 and 65 m during a 100 m in 10.1 (10.21 video time, wind < 2.0 m/s) according to Pr Ionov’s analysis. At this point of the race, his stride length was 2.54 m and frequency was 4.58 s/s. Source: Mehrikadze V. The purpose of competitive training model, Legkaya Atletika, no. 8, 1982.

11.82 Meters Per Second

“Lane 2” (USA) Colorado Springs Summer 1978

Two strides were filmed at 50 m from the start, using an LICAM 16 mm camera at 150 fps during a training camp sponsored by the USOC Development Committee. Twelve U.S. sprinters with lifetime bests that ranged from 9.9 to 10.4 participated to a study about physical and performance characteristics of male sprinters. The identity of the fastest one, “Lane 2”, can’t be revealed because of a ‘confidentiality agreement’ that prevents the public release of the names of athletes studied. The average length for the two strides filmed was 2.52 m, and stride frequency was 4.68 s/s. Taking into account the displacement of his center of gravity, his speed was 11.73 m/s. The author, Pr. Anne Atwater, noted that the group that attended the 1978 camp ran much faster than during the 1979 camp: “1978 Sprinters seemed more motivated as they each raced directly against two other sprinters and as they were not required to run the entire 100 m distance.” Altitude might have played a role since the 1978 camp was held at 1800 m, and no indication was given regarding the effect of the wind. Source: Atwater A. Kinematic Analysis of sprinting, Biomechanics Symposium, Indiana University, Bloomington, IN, October 1980, and personal communication with the author.

11.90 Meters Per Second

Calvin Smith (USA) Karl-Marx-Stadt 09.07.1982

Fastest 10 m interval during the anchor leg of a 4×100 m relay in 38.22 during the USA v GDR match. His fastest 30 m section was 2.54, timed by several cameras with digital timers activated by the official timing system, placed along the track. This was faster than during the 100 m race he won earlier in the day in 9.91, faster than the 9.95 by Jim Hines in 1968) but the wind was measured at 2.1 m/s, just over limit for World Record application. During this race, he was timed in 2.56 in the 30-60 m section (11.72 m/s) and 1.72 in the 60-80 m section (11.76 m/s). However, during Smith’s relay leg, the wind was under 2.0 m/s according to the East German report. Source: Hess WD. Aspects of the development in sprint and hurdles events in the Olympic cycle 1981/84, Leipzig, 1985.

Calvin Smith (right) of the United States narrowly beats British athlete Allan Wells (42) to the finish line during the 100m race at the Amateur Athletics Association Championships at Crystal Palace, London on July 23rd 1983.


12.04 Meters Per Second

Ben Johnson (CAN) & Carl Lewis (USA) Seoul 24.08.1988

Timed in 0.83 for a 10 m section during a 100 m in 9.79 for Johnson (later disqualified for doping) and in 9.92 for Lewis at the Olympic final (wind +1.1m/s). Intermediate times were given to the media by Swiss Timing and were later published by Omega in the booklet Athletics Full Results Seoul 1988. Those splits differ from the times published by IAF in the Final Report of the Scientific Research Project made by Moravec & Susanka from Prague Charles University (also in charge of 1987 World Championships analysis). This analysis “was done on the basis of recordings from five video cameras (50 fps) and five high speed (200 fps) film cameras”, says the IAF report, while Omega gives no details as how they came up with 10 m splits. The Omega times make no sense regarding the evolution of the race, and analysis with today’s video software analysis possibilities match with the times reported by IAF.

Canadian sprinter Ben Johnson competing in the 100 Metres semi-final at Seoul Olympic Stadium during the Olympic Games in Seoul, South Korea, 24th September 1988. Johnson won the final in a world record time of 9.79 seconds, but was disqualified for doping.


Table 1. 10-meter splits for Carl Lewis and Ben Johnson at 1988 Olympics in Seoul.
10-Meter Splits of 100-Meter Dash
Carl Lewis
IAF Report
1.89 2.96 3.90 4.79 5.65 6.48 7.33 8.18 9.04 9.92
1.89 1.07 0.94 0.89 0.86 0.83 0.85 0.85 0.86 0.88
Omega
1.97 3.00 3.89 4.81 5.65 6.53 7.37 8.23 9.06 9.92
1.97 1.03 0.89 0.92 0.84 0.88 0.84 0.86 0.83 0.86
Ben Johnson
IAF Report
1.83 2.87 3.80 4.66 5.50 6.33 7.17 8.02 8.89 9.79
1.83 1.04 0.93 0.86 0.84 0.83 0.84 0.85 0.87 0.90
Omega
1.95 2.93 3.81 4.69 5.52 6.37 7.22 8.06 8.93 9.79
1.95 0.98 0.88 0.88 0.83 0.85 0.85 0.84 0.87 0.86


In Rome on 30.08.1987, both Johnson (later disqualified) and Lewis reached 12.04 m/s for 10 m in the 100 m final (wind +1.0 m/s) according to the Fast results were available during the World Championships. The times were later corrected in the Scientific Report published by IAF, and their best 10 m turned out to be 0.85, hence 11.76 m/s.

Table 2. 10-meter splits for Carl Lewis and Ben Johnson in Rome, 1987.
10-Meter Splits of 100-Meter Dash
Carl Lewis
Fast Results
1.94 2.97 3.92 4.77 5.67 6.50 7.33 8.23 9.09 9.93
1.94 1.03 0.93 0.85 0.90 0.83 0.83 0.90 0.86 0.84
Scientific Report
1.94 2.96 3.91 4.78 5.64 6.50 7.36 8.22 9.07 9.93
1.94 1.02 0.95 0.87 0.86 0.86 0.86 0.86 0.85 0.86
Ben Johnson
Fast Results
1.86 2.87 3.80 4.66 5.55 6.38 7.21 8.11 8.98 9.83
1.86 1.01 0.93 0.86 0.89 0.83 0.83 0.90 0.87 0.85
Scientific Report
1.84 2.86 3.80 4.67 5.53 6.38 7.23 8.10 8.96 9.83
1.83 1.02 0.94 0.87 0.86 0.85 0.85 0.87 0.86 0.87


In Tokyo on 25.08.1991, Carl Lewis reached the same 12.04 m/s for a 10 m split during the World Championships 100 m final (wind +1.2 m/s) he won in a new World Record. Ten video cameras (60 fps) were located at 10 m intervals along the home straight of the stadium and the error allowance was +/- 0.02 seconds, according to the preliminary report published in New Studies in Athletics. Thus the 0.83 interval figure could also be a 0.84 (11.90 m/s) taking in account the accuracy level:

Table 3. Carl Lewis in Tokyo, 1991.
10-Meter Splits of 100-Meter Dash
Fast Results
1.88 2.96 3.88 4.77 5.61 6.46 7.30 8.13 9.00 9.86
1.88 1.08 0.92 0.89 0.84 0.85 0.84 0.83 0.87 0.87


During the quarter finals of these 1991 World Championships, Carl Lewis was timed in 0.80 for 10 m, 12.50 m/s speed, for a 100m time in 9.80 but the wind was blowing at 4.3 m/s.

Sources: Ae M & al. (1992) The men’s 100 meters, In: The Scientific Research Project at the III World Championships in Athletics: Preliminary reports. New Studies in Athletics, no. 1, March 1992; Ae M & al. (1994) Analysis of racing patterns in 100m sprint of the world’s best sprinters, In Japan Association of Athletics Federations (ed.), The Techniques of the World Top Athletics (Research Report of the 3rd World Championships, Tokyo) Tokyo: Baseball Magazine Co.

In Los Angeles on 04.08.1984, Carl Lewis was supposedly timed at 28 miles per hour (12.51 m/s) for his last 2 m of the 100 m Olympic final won in 9.99 (wind +0.2 m/s) according to Swiss Timing, as reported by Track & Field News magazine (October 1984 issue). No details were provided regarding the method, precision, and accuracy of this measurement.

12.01 Meters Per Second

Donovan Bailey (CAN) Atlanta 27.07.1996

Peak speed located at 50 m recorded by a laser device operating at 50 Hz during the 100 m Olympic final won in 9.84 (World Record, wind +0.7 m/s). For the first time, the system Laveg (Laser Velocity Guard) was used in an international competition. Like the spidograms released in USSR in the early 1950s, the laser records velocity oscillations that occur during each stride that allows counting the number of steps. Smoothing the curve is necessary to obtain an average speed over several steps. A raw graph format using a “factor 7” smoothing shows velocity curve shows a range between 11.2 m/s and 12.7 m/s within stride cycles in the 50-60 m section in Bailey’s 100 m race. A speed curve graph appeared on TV within seconds after the final, showing a 12.1 m/s at 59.8 m. A “factor 49” smoothing, used in the final report, gives 12.01 m/s at 50 m and two other peaks very close to 12 m/s at about 53 and 59m. Sources: Türk-Noack A. LAVEG-Analyse of the 100 m sprint; Laser speed measurement for analyzing translational movements. Symposium of the athletics, Bad Blankenburg, 2002.

Another interpretation of this Laveg measurement is found in Grosser M, Renner T. Schnelligkeitstraining, BLV Buchverlag, Munich, 2007. Bailey’s top speed is still 12.01 m/s but it is now located at 54.55 m after 5.95 s into the race!

The authors also give 10 m splits from the smooth curve which result in a speed of 11.90 m/s for Bailey’s fastest interval.

Table 4. Donovan Bailey in Atlanta, 1996. Laveg Laser Velocity Guard.
10-Meter Splits of 100-Meter Dash
1.90 2.93 3.84 4.71 5.55 6.39 7.24 8.09 8.95 9.84
1.90 1.03 0.91 0.88 0.84 0.84 0.84 0.85 0.86 0.89


Note that the 10 m intervals times don’t add-up exactly with the intermediate times. The reason in that these times are calculated and rounded from the average speeds for each interval by the Laveg software.

The full accuracy times are questionable in that the times at 40 m published by Grosser and Renner don’t correspond to the distances shown in photographs taken from the stands by Pascal Rondeau for Allsport Agency (the yellow marks are located at 38.5 m from the start and the white marks at 40.28 m). Fredericks (lane 5) was timed in 4.69, Mitchell (lane 4) in 4.70 and Boldon (lane 3) in 4.71. It’s disputable that Bailey (lane 6) would also been given 4.71 from these pictures:

A general view of the men’s 100m finals won by Donovan Bailey of the Canada at the Olympic Stadium at the 1996 Centennial Olympic Games in Atlanta, Georgia. \ Mandatory Credit: Pascal Rondeau /Allsport


An analysis of Bailey’s run was also published in China by Feng Dengshou. Technical characteristics of Bailey’s World Record setting 100m running, Sport Science Research, Vol.17, no.4, Dec. 1996. But the intermediate times are quite different and no details are given regarding the methodology:

Table 5. Donovan Bailey in Atlanta, 1996. Feng Dengshou Analysis.
10-Meter Splits of 100-Meter Dash
1.87 2.96 3.89 4.78 5.62 6.45 7.28 8.12 8.98 9.84
1.87 1.09 0.93 0.89 0.84 0.83 0.83 0.84 0.86 0.86


Sources: Türk-Noack A. LAVEG-Analyse of the 100 m sprint; Laser speed measurement for analyzing translational movements. Symposium of the athletics, Bad Blankenburg, 2002.

12.04 Meters Per Second

Tyson Gay (USA) Eugene 28.06.2008

Timed in 1.66 for 20m (two consecutive 0.83 intervals) between 50 and 70 m during the 100 m U.S. National championships quarter-final won in 9.77 (wind +1.6m/s), using four videos recorded by cameras showing the flame of the gun and placed in the upper stands at the 50, 55, 60 and 70 m marks. Source: time analysis through the video material by Pierre-Jean Vazel.

Tyson Gay of the United States reacts after crossing the finish line in the Men’s 100 metres semi-final during day two of the 15th IAAF World Athletics Championships Beijing 2015 at Beijing National Stadium on August 23, 2015 in Beijing, China.


12.20 Meters Per Second

Usain Bolt (JAM) Beijing 16.08.2008

Timed in 0.82 for 10 m between 60 and 70 m during the Olympic 100 m final won in 9.69 (World Record, wind 0.0 m/s) using videos (50 or 60 fps) recorded by camera showing the flame of the gun and placed in the upper stands in either sides of the stadium at the 10, 30, 60 and 90 m marks, as well as with TV replays including a travelling view. Other intermediate times were calculated from the intervals of the men and women’s hurdles marks on the track. Several time analyses flourished on the internet but it’s unlikely that they were based on in situ video recordings of the race. Source: time analysis through the video material by Pierre-Jean Vazel.

August 16, 2008, Usain BOLT of Jamaica sets the world record at 9.69 when he wins the 100 m dash final at the National Stadium on the Olympic Green at the XXIX Olympiad in Beijing on Saturday. Toronto Star/Steve Russell (Photo by Steve Russell/Toronto Star via Getty Images)


Table 6. Usain Bolt in Beijing, 2008.
10-Meter Splits of 100-Meter Dash
1.84 2.87 3.78 4.65 5.49 6.32 7.14 7.97 8.81 9.69
1.84 1.03 0.91 0.87 0.84 0.83 0.82 0.83 0.84 0.88


12.35 Meters Per Second

Usain Bolt (JAM) Berlin 16.08.2009

Peak speed located at 67.90 m by the Laveg system during the World Championships 100 m final won in 9.58 (World Record, wind +0.9 m/s). The analysis was performed by Eberhard Nixdorf (Olympiastützpunkt Hessen at Frankfurt) and this result published in the final report in 2011 is slightly different compared to the preliminary report given via the IAAF to the media the day after the race which also included top speed and calculated 10 m intermediate times.

Table 7. Usain Bolt in Berlin, 2009.
10-Meter Splits of 100-Meter Dash
Scientific Research Report issued on 17.08.2009 at 8:00 pm
1.89 2.88 3.78 4.64 5.47 6.29 7.10 7.92 8.75 9.58
1.89 0.99 0.90 0.86 0.83 0.82 0.81 0.82 0.83 0.83


Maximum velocity: 12.27 m/s at 65.03 m

Table 8. Usain Bolt in Berlin, 2009.
10-Meter Splits of 100-Meter Dash
Biomechanical Analysis of the Sprint & Hurdle Events, New Studies in Athletics, 2011
1.88 2.88 3.78 4.64 5.47 6.29 7.10 7.92 8.74 9.58
1.88 1.00 0.90 0.86 0.83 0.82 0.81 0.82 0.82 0.84


Maximum velocity: 12.35 m/s at 67.90 m (0.81 = 12.35 m/s)

The raw speed curve of the Laveg recording showed variations between 11.7 and 13.2 m/s during the stride cycles in the 50 and 60 m of the race.

The race was also filmed by 50 fps camera with digital timers activated by the official timing system, placed along the track at 20 m, 40 m, 60 m and 80 m. It provided frames every 0.02 seconds and the missing frame was extrapolated in order to get 0.01 second times. The analysis was led by Rolf Graubner (fgs Halle-Wittenberg) and given to the IAAF the day after the race:

2.89 – 4.64 – 6.31 – 7.92 – 9.58

(1.61 for 20 m = 12.42 m/s, fastest 10 m would be 0.80 = 12.50 m/s).

These intermediate times might be more accurate than the Laveg calculation since video frames are similar to photo finish pictures as the times “shall be taken to the moment at which any part of the body of an athlete (i.e. torso, as distinguished from the head, neck, arms, legs, hands or feet) reaches the vertical plane of the nearer edge of the finish line”, as per IAAF Rule 165.2. From 1913 until 1953, it was required that the entire body be across the line for a finish, which is practically the same as the Laveg system, since the back is usually the targeted part of the body.

The different figures for Usain Bolt’s top speed in the same race using video and laser timing measurement show how difficult it is to get a precise and accurate figure of sprinting maximum velocity, and this will remain a big challenge for the future.

I would like to thank Anne Atwater, Rolf Graubner and Hansruedi Kunz for their insights and explanations regarding their respective scientific research. Any corrections, amendments and proposals are welcome as this list is the first draft.

Please share so others may benefit.


The post A Historical Progression of Sprinting Top Speed World Bests appeared first on Freelap USA.

ALTIS Return to Play: A Case Study with Freelap Technology

$
0
0

ALTIS and Freelap — two of the biggest names in T&F — have come together to celebrate progress in our sport. We hope you enjoy this week’s blog-post. Share if you enjoy it!


ALTIS Sprinter

By Kyle Hierholzer, ALTIS

In my previous post, Returning to Play the Altis Way, I discussed five major principles that contribute to an effective return to competition for injured athletes.

These principles are:

  1. Gathering Information
  2. Having Entire Performance Staff on the Same Page
  3. Keeping Training Gaps Small
  4. Using Landmarks not Timelines
  5. Providing Quality Therapy Inputs

Each of these five components shares equal importance in determining the desired outcome for the athlete. I do not think it is possible to say that in all situations one component is more valuable than the other; however, the lack of any component can undermine the entire process. Therefore, we strive to execute each component with the utmost quality. As you may have read in my previous posts concerning the debrief process, we have a detailed and structured debrief system that we implement on a daily basis – as well as post-competition and post-season. This debrief process aids us in Gathering Information. We have also sought out and hired a therapy team that we are confident delivers very high Quality Therapy Inputs to our athlete population on a daily basis.


We are dealing with people and emotions, and everyone is striving for the well-being of the athlete.
Click To Tweet


In the same sense, we are always looking for quality technologies that can aid us in all aspects of training, but especially in the High Performance and Return to Play realms. In this post, I will outline a case study for an athlete involved in our return to play procedures, and how we utilized a Freelap timing system to monitor Training Gaps and to track Landmarks. It’s a difficult undertaking to present an accurate and detailed case-study that covers all of the moving pieces, but I will attempt to do so in a way that is organized and provides real-world examples of how the above five principles were put into action. In each realm, we are dealing with people and emotions, and everyone is striving for the well-being of the athlete. Sometimes the best-laid plans go awry, and adjustments are made on the fly. This is the true art of coaching in my opinion. Whenever the human element is involved, there is a delicate balance that needs to be upheld. Teaching moments are critical, and often ‘Return to Play’ (RTP) situations provide the opportunity for some “Come to Jesus” meetings that can get to the heart of underlying issues.

Case Background (Gathering Information)

Before we can get to the heart and soul of this post, it’s important that the reader has some context about how we reached a point in the RTP process where we could utilize the Freelap system. The athlete is a female jumper that we will call Athlete Q. Athlete Q (henceforth known as AQ) suffered from a difficult-to-treat chronic injury puzzle. The athlete had radicular pain, a functionally short leg, severely reduced power output, and a myriad of compensation schemes that changed depending on the presentation of the day. While debriefing AQ, it was discovered that the initial injury occurred close to the end of the previous season (before joining ALTIS), received little to no therapy inputs, and competed a number of times with big training gaps between competitions. These competitions were unsuccessful, and stress levels were exceedingly high as emotional batteries were drained. Upon conclusion of that season, AQ took complete rest. Initial training the following season started off very well, but once intensity was increased, the same pain loops returned. The therapy team began providing inputs in a what else, where else fashion to try and track down the culprit, or collusion of culprits, that prevented proper healing. Through the excellent work of talented therapists, a management strategy was developed which provided relief and improved training quality. This enabled AQ to compete and train in moderation.

Physical Therapist

However, power output was still reduced from optimum, and most of the competitive season was lost. After communication within AQ’s performance staff, the decision was made to investigate a PRP injection at the hands of a skilled practitioner through the ALTIS network. Ultrasound images showed that PRP was indeed a viable option, and a procedure was completed immediately upon completion of the season. The procedure went smoothly, and the next phase of the return to play process began.

Post Procedure Strategy

The days immediately following a procedure can have a huge impact on the outcome. Below, I will lay out in detail the process that was followed as AQ moved from a period of complete rest to high-intensity sprinting. Please note that the information below is given in chronological order because that is the simplest way to share it. However the principle of Landmarks over Timelines was used, and when possible, the Movement Landmark that was achieved will be described. The performance team coordinated effectively with all doctors and therapists involved. A post-procedure strategy was developed with inputs from each party. Coach Dan Pfaff served as the gatekeeper, and guided AQ forward based off our RTP principles.

Please see the detailed execution of strategy below with notes as taken through the process.

Day 1-5

Complete Rest – PRP incubation period as prescribed by a physician and agreed with by performance staff.

Day 6-15

During this period, AQ trained every other day. The training emphasis was on slow and controlled movements in efficient movement patterns to begin motor re-education and create appropriate brain maps. This is necessary due to the numerous compensation patterns that elite athletes can develop when in chronic injury situations. All activity was low intensity, light jogging was allowed, and bike workouts were permissible as long as no local tenderness was felt.

Training days consisted of:

  • Walking Warm Up – emphasis on motor re-education – mindfulness!
  • No accelerations at end of warm up
  • Single Leg Multiple Jumps on Healthy Leg
  • Controlled Movement General Strength Circuits
  • Bike Workouts

Day 16 – 20

Upon the completion of Day 15, it was observed that AQ was able to complete the regular warmup in a walking fashion with efficient movement patterns and no pain (landmark). No pain was reported by AQ in any other area of training. Therapy inputs consisted of general flush massages, but no direct work was done on the site of the procedure. Based off this information, the decision was made to advance to the next series of landmarks in our RTP process. AQ gradually increased intensity to 60-70% while controlling knee extension on all drills and running. Fatigue and soreness were monitored strictly through daily athlete debriefs (pre-session, peri-session, post session). Weight-room activities resumed with heavy single-leg snatch. Light to moderate double-leg deadlift – slow and controlled in both contractions – was also added. The rest of the weight-lifting was done normally for that period of the year. A steady-state run building up to 20 minutes was added, and all were governed by posture, form, pain, etc. At the first sign of a breakdown in any of these areas, the activity was stopped.

Training Days consisted of:

Day 16:

  • Warm up A at low intensity
  • Accelerations at end of warm up at 40-50%
  • Acceleration Development
  • Dribbles over the ankle 3 x 30, 40, 50
  • Multiple Jumps – 5 x 3 x 5 small hurdles w/pause
  • Emphasize flat landings and congruent amortization angles
  • Strength Training
  • Jog Cool Down

Day 17:

  • Warm B at low intensity
  • Accelerations at end of warm up at 40-50%
  • Approach Development x 6-8
  • Over the ankle dribbles into low-intensity straight leg bounds
  • Speed Development – 6 x 80m ankle/calf dribbles with emphasis on “bounce”
  • Multiple Jumps – Rudiment 2 x 20m – done with low amplitude effort
  • General Strength and Med Ball Circuits x 1 each
  • Jog Cool Down

Day 18:

  • Warm Up A at low intensity
  • Accelerations at end of warm up at 40-50%
  • Bike Workout – fartlek fashion – set seat for proper pelvic posture
  • Strength Training
  • Jog Cool Down

Day 19:

  • Steady run
  • AQ was able to run for 11’ before losing posture and form, felt dull ache at IT (Iliotibial)

Day 20:

  • Warm Up A – moderate intensity – Accelerations at end of warm up at 50%
  • Dribble Accelerations – 4 x 30, 40, 50m
  • Multiple Jumps – 5 x 3 x 5 small hurdles w/pause
  • Emphasize flat landings and congruent amortization angles
  • Strength Training
  • Jog Cool Down

Day 21-69:

At the completion of Day 20, it was observed that AQ handled the increase of intensity with no loss of motor control or increase in pain. Movement patterns began to stabilize, but still required a high level of mindfulness. The addition of strength training created normal tension but did not limit movement capacities at the injury site. Therapy inputs reduced tension, and tissue quality was monitored at and around injury location. AQ handled each of these areas well from a mindset perspective; however, there was a feeling of disappointment that the season had come to a close on a low point. Thus, motivation and esteem began to waiver during the redundant portions of the RTP process. This was noted by the staff, and through discussions with the athlete, we decided this was an opportune time to implement the next phase of our RTP strategy.

This phase was highlighted by a 10x50m routine. Starting twice a week – and eventually moving to 3 times a week – AQ would run 10 x 50m. AQ was asked to report the Rate of Perceived Intensity (RPI) for each run. During each session, the RPI was to increase as pain, posture, form allowed. Each session, the goal was to increase the RPI from the session before. A ‘walk-in’ start was used early on to relieve stress on the injury site during the acceleration phase. This gradually progressed to a roll-over start, and eventually to a static start with various depths. Runs were initially done in flats, and eventually, spikes were used.

An integral part of this process was the use of the Freelap timing system. The timing system was set up to record the last 30m of each run. In addition, a coach manually timed the entire 50m of each run. Both times were recorded along with AQ’s RPI for each run. Specifically, AQ was not told either time until the RPI had been reported. At the conclusion of each session, the average was recorded for each metric and given to AQ.

The use of Freelap provided many teaching moments that would not have existed otherwise. First of all, AQ was able to get immediate feedback on the accuracy of the RPI for each run. This led to increasingly accurate abilities of AQ to ‘feel’ the quality or lack of quality for each run. It allowed the coaches to point out errors in the first 20m of the run that may have ‘felt’ fast to the athlete, but created a lack of momentum and thus a slower fly 30m. Overall, the ease of use of the system created a simple and accurate way to track and quantify actual improvements in the maximum velocities handled by AQ over the course of the RTP process.

The value of having an objective way to give feedback on Key Performance Indicators is something that should not be taken lightly, and all coaches would be wise to utilize this type of technology. The feedback from the Freelap system held AQ to a higher level of accountability, fostered more excitement and competitiveness in each session, which led to greater rates of improvement in our opinion. AQ felt that the use of the system allowed her to associate the execution of a KPI (Key Performance Indicator), that otherwise felt foreign and wrong, with a positive outcome; therefore, building increased trust and confidence in the performance team and the RTP process.

The weekly setup during this period is as follows below:

Table 1. Return to Play Weekly Setup
Day Setup
Monday Warm Up A – Normal Intensities
4 x 30, 40, 50m – Dribble ankle, calf, knee
Later replaced with 10x50m series once AQ ran 8m/s landmark
Multiple Jumps – progressing intensities
Strength Training
Cool Down
Tuesday Warm Up B
10x50m – Freelap
MJ – Rudiment
GS/MB Circuits
Optional Ancillary Lifting
Cool down
Wednesday Warm Up A
Bike Workout Special End – eventually becoming Special End Up/Backs on the track
Strength Training
Cool down
Thursday Steady State Run – eventually becoming Fartleks
Optional Ancillary Lifting
Friday Warm Up B
10x50m – Freelap
Multiple Throws
Strength Training
Cool Down
Saturday Warm Up B
Special Endurance Runs – progressively increasing intensity and rest between runs
Hurdle Mobility
Optional Ancillary Lifting
Cool Down
Sunday Rest, Epsom Salt Bath, Flush Massage


The chart below tracks AQ’s progress from Day 21-70. During the 4th week of the 10x50m process, the decision was made to add an additional session on Monday. This coincided with the normal increase of training volume in our ‘2 on 1 off’ training scheme. The staff was comfortable with this decision because the Freelap Fly 30 averages had stabilized in a cluster with no negative reports from AQ in regards to injury site or from therapy staff involved in the process. This week also saw a move away from Wednesday Bike workouts to on-the-rack special endurance runs in the form of up-backs (60m acceleration in one direction, deceleration, turn around, 60m back the other direction). These runs were initially completed at low intensity and were purposefully not timed to control arousal level and safeguard intensity following the Monday-Tuesday Sessions.

10x50 meter sprint progression

Chart 1. Athlete Q 10x50m progression from day 21 through 70.


Several interesting trends emerged over time from the Freelap Data. Often the Friday session was the fastest session of the week. At the beginning of the process, the fastest runs occurred early in the session (Run 3-4), but over time shifted to the latter runs (Run 8-9). It also appears the performance team may have added in the Monday 10×50 session a bit too soon, and in future RTP scenarios will take a hard look at the value of having the session at all versus just dribbling or doing untimed accelerations.

Interestingly, following the completion of the RTP process for AQ, the staff decided to do some baseline testing to see where AQ was leading into the transition time for the next season. AQ ran season bests in Freelap FLY 30, and 45-second run; jumped season bests in Standing Long Jump (also Personal Best), Standing Triple Jump, and threw SBs in Overhead Back and Underhand Forward.

Needless to say, with the success of these results, AQ concluded the RTP process on a high note and felt accomplished going into a much-needed mental and physical rest period prior to beginning training for the following season. The combination of an athlete-centered ‘Return to Play’ process combined with Freelap’s top of the line technology proved to be a highly effective pairing.

Please share so others may benefit.


The post ALTIS Return to Play: A Case Study with Freelap Technology appeared first on Freelap USA.

KETO – or not to KETO – That is the Question

$
0
0


Keto Diet

By Dominique Stasulli

The debate between manipulating carbohydrate and fat metabolism for various weight loss and performance outcomes has gone back and forth by researchers for several decades, with no conclusive evidence supporting the extreme elimination diets we see so heavily marketed today. In the 1990s, high-carbohydrate nutrition was favored by the sports nutrition guidelines, recommending that at least 55% of energy come from carbohydrates in a given day (Burke, 2010). For endurance athletes, this number was recommended at greater than 60%; however, the research failed to support ‘why’ athletes needed this sort of macronutrient ratio for training (Burke, 2010). The evidence came after the millennium when it was found that higher carbohydrate intake could reduce (though not completely prevent) overreaching stress symptoms such as fatigue, sleeplessness, hormone disruption, and sub-par performance (Burke, 2010). In fact, withholding carbohydrates during the first few hours of recovery may hinder the functionality of the immune system and accentuate the immunosuppression occurring post-exercise (Burke, 2010). In addition, it was not found that moderate carbohydrate intake provided performance enhancement over a high-carbohydrate intake, so the guidelines remain in favor of carbohydrate availability for training purposes (Burke, 2010). High-fat nutrition has renewed interest once again, but is there enough to support a case for today’s endurance athlete?

The availability of a given substrate in the body largely determines our body’s fuel of choice at rest (Spriet, 2014). Exercise increases the metabolic demand on the body several-fold upon beginning a training session from rest, after which the body strives to achieve a steady state of aerobic intensity where the proportion of carbohydrates and fats finds an equilibrium in relation to an individual’s preference of fuel source (Spriet, 2014). When the power output of exercise exceeds 60% of maximal oxygen uptake (VO2max), studies have shown a decreased reliance on fat oxidation as a fuel source (Spriet, 2014). This decrease in free fatty acid release at higher intensities is likely due to a diversion of blood flow from adipose tissue to contracting muscles (Spriet, 2014). Above 75% of the VO2max, the majority of energy is derived from carbohydrate use, specifically muscle glycogen, in moderately trained individuals (Spiret, 2014). This is an important concept to consider when an endurance athlete is aiming to compete at 70-75% of maximum for extended periods of competition. The question remains whether or not it is possible to “teach” the body how to metabolically prefer fat as a fuel source at these competition intensities, which would go against the “default,” so-to-speak, of our innate preference for carbohydrates at these speeds.

Carbohydrate Intake

Carbohydrates have gotten a bad rap for supposedly contributing to an ever-growing trend of obesity and metabolic syndrome in our country. On a physiologic level, carbohydrate intake results in a release of insulin by the body to help shunt glucose into depleted cells, or in the case of an inactive population, into the fat cells for conversion and storage, resulting in excess weight gain. Upregulated insulin inadvertently inhibits the transfer of fat across membranes, blocking fat oxidation (also known as lipolysis) during exercise and even at rest (Spriet, 2014). The reverse is true also: in the presence of high-fat, carbohydrate metabolism is down-regulated (Hawley & Leckey, 2015). The proposed theories of high-fat, low-carb exploit this physiologic mechanism as a way to increase fatty acid oxidation at the expense of restricting carbohydrate intake. The attraction to high-fat, low-carb diets for athletes has recently caught the attention of many through the media highlights of any given elite who has successfully clinched a podium spot in a championship, purely by running on a ketogenic diet or the like. While these performances are being attributed to the nutritional habits of these athletes, the research says there is no correlation between increased fat oxidation and performance (Hawley & Leckey, 2015). Carbohydrates, not fat-based fuels, are the rate limiting factor in performance in trained endurance athletes (Hawley & Leckey, 2015). Fat-rich diets directly impair rates of muscle glycogenolysis, limiting high-intensity ATP-production necessary for energy at these paces (Hawley & Leckey, 2015).

Glycogen Sparing

Theoretically, if one can increase the availability of free fatty acids to the working muscles through a high-fat intake pre-workout or during a workout, precious glycogen in the muscles will be spared. Unfortunately, dietary attempts at proving this theory have been largely unsuccessful due to the slow oxidation of fat in relation to the rapid process of glycolysis (Spriet, 2014). Glycogen “sparing” sounds attractive, though closer examination of our physiology proves it is detrimental to inhibit the glycogenolytic process, a prerequisite for successful endurance performance (Hawley & Leckey, 2015). Some research has been successful in finding that high-fat dietary interventions do in fact increase the body’s ability to oxidize more fat during exercise, however, no increases in performance followed this metabolic shift (Spriet, 2014). Slower VO2 kinetics have also been observed following six days of a high-fat versus high-carb diet, supporting the field of evidence of performance detriment associated with this metabolic adaptation (Hawley & Leckey, 2015). In addition, unless the high-fat diet intervention is maintained, the desired metabolic shift is not a permanent change in the body (Spriet, 2014).

An overwhelming number of metabolic studies performed to date are on untrained subjects, in a fasted state, at a low-to-moderate intensity, and neglect to test at the same relative work-rate for pre- and post-experimentation; these conditions alone fail to mimic competitive race conditions and absolutely favor fat oxidation (Hawley & Leckey, 2015). The results we see published cannot be related to high-level athletes nor high-intensity workloads and should be applied no further than the general, untrained population upon whom these tests were conducted.

Study Population

Few studies do include experienced athletes as their subjects. One such study performed on cyclists undergoing a short-term (28d.) ketogenic (<20g carbs/day) diet observed a threefold drop in glucose oxidation and fourfold drop in muscle glycogen utilization which appears impressive. However, four of the five subjects experienced a reduction of VO2max as a result (Hawley & Leckey, 2015). The relationship between VO2 (measured in liters per minute) and speed is linear. Therefore an increase in the respiratory exchange ratio (RER) in favor of carbohydrate utilization, say from 0.97 to 1.00, results in a 0.73% increase in energy yield per liter of O2 consumed. This yield is directly proportional to a 0.15km/hr running speed increase in the top elite distance runners which would break the current world marathon record by 50 seconds under total carbohydrate-dependence (Hawley & Leckey, 2015).

Train Low, Compete High

The “train low, compete high” theory regarding carbohydrate refueling has been proposed as an alternative method to teaching the athlete’s body how to operate on a more metabolically efficient level (Burke, 2010). This concept requires an athlete to train with low-carb intake to increase the ability of the body to utilize fat as a primary fuel source, and while there is research to support this concept, none has been linked to a subsequent performance benefit (Burke, 2010). Moreover, there is evidence that training “low” reduces the ability to train at higher intensities due to an increased perception of effort and reduction in power output (Burke, 2010). In the eyes of a coach, this is not a favorable outcome during a progressive training cycle since outcome-defining training is conducted at high intensity, often at race pace or faster. Not to mention, the risk of illness associated with this dietary restriction is not worth the “efficiency” achieved for low-moderate intensity workloads (Burke, 2010). This nutritional strategy is best reserved for early season, low-intensity base-building work, which can safely be done in a glycogen-depleted state, for the purpose of shaping an ideal body composition before fuel-dependent high-volume and/or high-intensity training begins. Competitive athletes, aside from the occasional keto-black sheep, still freely select carbohydrate-rich diets for the benefit of sustaining muscle energy reserves and meeting high-stress training and performance demands (Hawley & Leckey, 2015).

Please share so others may benefit.


References

  1. Burke, L. M. (2010). Fueling strategies to optimize performance: Training high or training low? Scandinavian Journal of Medicine & Science in Sports, 20, 48-58.
  2. Hawley, J. A. & Leckey, J. J. (2015). Carbohydrate dependence during prolonged, intense endurance exercise. Sports Medicine, 45(Suppl 1), S5-S12.
  3. Spriet, L. L. (2014). New insights into the interaction of carbohydrate and fat metabolism during exercise. Sports Medicine, 44, S87-S96.

The post KETO – or not to KETO – That is the Question appeared first on Freelap USA.

How To Build Speed Hurdles for the Wicket Drill

$
0
0


Speed Hurdles for Wicket Drill

By Mario Gomez

Coaching is expensive. It consumes your personal time and bank account. We get paid in personal satisfaction, passion, happiness, competitiveness, and growth. However, our bank statements only reflect withdrawals for expenses and tiny amounts of monetary deposits for work. If you break down a coach’s stipend and divide it by the amount of hours spent on work, it most likely averages to pennies on the hour. Coaching is a labor of love. Increasingly, budgets are being reduced, particularly in sports like track and field.

If this situation describes you, you have to be creative with spending. Speed Hurdles are not cheap. A new set of six can cost as much as $40. Adjustable ones are even more costly. We tried using small cones or disc cones, but they didn’t have the same benefit as actual wickets. The solution: build your own wickets. This article serves as a practical guide in creating wickets in a frugal and simple manner. It outlines how we created 20 wickets for less than $2.00 apiece. You can change the dimensions to create wickets for whatever purpose is desired.

The next article, Part 2, discusses how we use the wickets, with special emphasis on the different spacing according to the skill levels of your athletes and the time of season. In the meantime, grab the spare change in your savings jar and build your first wicket!


Video 1. How to build speed hurdles for the wicket drill.

Total Materials

  1. Five 10-foot-long PVC pipes, half-inch width (5x$2.18 each pipe = $10.90).
  2. Forty 90-degree half-inch elbows (40×22 cents per elbow = $8.80).
  3. 40 half-inch PVC insert fitting Ts (40×48 cents apiece = $19.20).

Materials for Each Wicket

  • One 14-inch length PVC pipe
  • Two 6-inch lengths PVC pipe
  • Two PVC T fittings
  • Two 90-degree PVC elbows

Construction

  1. Cut one 14-inch piece of PVC pipe to use as the crossbar (top) of each wicket. Next, cut 19 more equal pieces, using the first length as a model. This accounts for 280 inches of the 10 PVC pipes, leaving 420 inches.
  2. Cut one 6-inch pipe segment to serve as a guide for the posts (sides) of each wicket. Then cut 39 more equal pieces. This uses another 240 inches of the PVC pipe. That leaves 80 inches of unused PVC pipe, which you may be able to use elsewhere.
  3. Use two elbows, one at each end of the 14-inch crossbars, to join the crossbars with the 6-inch posts and form the top and sides of the wickets.
  4. Insert a T at the bottom of each post to serve as the base of the wicket.
PVC cut into six inch pieces

Figure 1. Cut the 1/2″ PVC into 6″ and 14″ sections.


Speed Hurdle

Figure 2. Final assembly of the speed hurdle.

After building the first set, we created 40 more wickets so we could have three different settings to accommodate all skill levels within our program. It added slightly to the overall cost but the added benefits are invaluable.

Please share so others may benefit.


The post How To Build Speed Hurdles for the Wicket Drill appeared first on Freelap USA.

The Implementation of Resisted Sled Sprint Training: Programming, Periodization and Concurrent Training

$
0
0


Resisted Sled Sprinting Training Program

By George Petrakos

This article is the second part of a mini-series on resisted sled sprint (RSS) training. Please read Part 1 first. This article will not deliver the ’best resisted sprint sessions for your athlete’, or ‘how to periodize your sprint program’. Instead, the article provides the basis for you to construct resisted sprint sessions based on the requirements of your athlete.

A Requirement for RSS Training?

A sprinting performance model contains a myriad of factors. However, we can generalize physical factors into two broad categories:

  1. Physical output
  2. Efficiency of physical output

Increases in physical output for improvements in sprint performance can be achieved through both ‘non-specific’ [1, 2] and ‘specific’ methods [2, 3]. Non-specific methods, such as general maximum strength and power training, may provide an efficient transfer to sprint performance for less-trained individuals. Less-trained individuals may require a foundation of general muscle force and power production that is best acquired by non-specific means. Non-specific means are also vital for improvements in lean muscle mass, training resilience and injury prevention. Specific means, such as sprinting, will likely have the greatest impact on the sprint times of well-trained athletes [4].

Improvements in the efficiency of physical output must be obtained by specific methods. Application of ground reaction force, rather than the magnitude of ground reaction force production, is a significant determinant of sprint performance [5-8]. In a mix of top-class (World or European medallists) and national level male sprinters, acceleration and maximal velocity performance were strongly related to horizontal force and the angle of force application [5]. Performance was not related to total nor vertical force, suggesting that maximal and vertical force production are key determinants of sprint performance in high-level sprinters.

Conversely, in physical education students, the vertical force at maximal velocity is a determinant of maximal velocity during a treadmill sprint [6]. Furthermore, many will quote Weyand et. al. [9] regarding the relationship between total ground reaction force and sprint performance. In this study, the fastest athlete produced 1.26 x the force of the slowest athlete, with total force predicting 39% of the variance in maximal velocity on a treadmill [9]. However, this study used male and female participants of whom produced maximal velocities of 6.2 – 11.1 m/s during a treadmill sprint. The large range in participant ability questions the validity of the argument that maximum sprint velocity is significantly related to the production of large ground reaction force. However, both studies demonstrate there is a certain level of force production, required for improved sprint performance, but it does not provide evidence that total force differentiates sprint performance between high or elite level athletes [5-7]. Although every athlete has individual requirements, traditional strength training for general or vertical force production has a significant role in speed development in untrained, novice or slower athletes. This is a general comment as each individual has their own requirements for improved sprint performance.

To continually chase vertical gains beyond a certain threshold with high-level athletes may provide a polish to the gym records board, but with little positive effect on the stopwatch.

Horizontal-based exercises provide a mode of resistance training that can develop both sprint specific force production and application. Resisted sled sprint (RSS) training emphasises the skill of sprinting, movement-specificity, horizontal force production and application. RSS training can be accurately manipulated by changes in intensity, volume and concurrent exercise selection. Therefore, there is a real opportunity to periodize and program RSS training with the same level of detail and accuracy that we commit to squat, deadlift, jump squat and Olympic lift variations. Sled load can be manipulated to influence horizontal force production and application, whilst sprint distance and number of repetitions will affect the ‘practice’ time of the sprinting skill. Simply, RSS training can be classed as both a skill and strengthening exercise, increasing the level of transfer efficiency to sprint performance from traditional strength and power training.

Physical output, Efficiency of Physical Output and RSS Training

Many RSS studies prescribe load as a % of body mass (%BM). However, I will attempt to interpret these data to provide RSS training recommendations for volume, intensity and concurrent training.

Figure 1 provides a general overview of the potential adaptations to RSS training. As always, general findings should be applied with caution – know your athlete, know what they have and what they require. Decide upon an adaptation and chase it.

Potential Long-Term Adaptions to Varying RSS Loads

Figure 1. Potential Long-Term Adaptions to Varying RSS Loads


A load of 10%BM does not provide a stimulus for enhanced explosiveness in the acceleration phase [10-13]. Horizontal ground reaction force is greater at RSS loads of 20%BM than unresisted sprinting (URS) and 10%BM [10], while a load of 30%BM provides a greater horizontal impulse than 10%BM [11]. Therefore, we are looking at heavier sled loads for enhancements in physical output.

The efficiency of physical output following RSS training may involve changes in foot-strike position, braking forces, ground contact time and angle of ground reaction force [11, 14-16]. It is hypothesised that RSS training may eventually decrease braking forces (vertical force), providing a foot strike more under the center of gravity and thus increasing the time for propulsive force production [15, 16]. Therefore, RSS training does not cause adaptations for longer ground contact times but teaches the athlete to use more of the ground contact time to create propulsive force. Compared to light sled or URS training, heavy sleds provide the athletes with more practice of horizontal force application [11]. There are two common coach issues with heavy RSS training, and I have attempted to provide a resolve for both of them in Table 1. Heavy RSS loads may also improve sprint specific rate of force development (RFD) [12]. Using heavier RSS loads to improve RFD for sprint performance may be superior to traditional vertical methods (Olympic lift variations, concentric jumps) due to the horizontal application of force in RSS training. The specific intermuscular coordination required for rapid horizontal force production in RSS training may have a greater efficiency of transfer to sprint performance than, say, the mid-thigh clean pull. Further research is required on the relationship between the development of resultant RFD, vertical RFD, horizontal RFD, horizontal force application and sprint performance.

Table 1. Common ‘heavy sled’ issues expressed by researchers and strength & conditioning coaches.
Issues Possible Solutions
Heavy sled sprinting will change sprint mechanics and will therefore be detrimental to sprint performance. From a recent review of 11 studies, not one found conclusive evidence of a reduction in sprint performance following RSS training. In fact, studies using ‘heavy’ or ‘very heavy’ sleds found marked improvements in sprint performance [3, 21, 22]. It is possible that the acute change in sprint mechanics during RSS repetitions provides the overload required for an improvement in long-term sprint mechanics and sprint performance. In the same vein, loaded jump squat and back squat mechanics are different to those of a vertical jump. However, we know that heavy strength and power training improves jump height.
Heavy sleds increase contact time and create a ‘slow’ feeling for the athlete. I agree. Heavy sleds do increase ground contact time, allowing for a greater potential for increased force production and horizontal propulsion [10, 11, 16]. Thankfully, programming for speed is not black and white. We can create sessions where we combine heavier work (heavy sled) and work designed to improve contact time and reactive strength. We can add heavy RSS training into a program founded on URS and plyometric work. Use complexes, contrasts and supersets!


While RSS training can overload the force component, RSS force production is significantly less than that of unloaded jumping, loaded jumping or heavy back squat exercises [17]. I do not recommend RSS training to improve maximum triple extension force production. RSS training has many uses, but there are more effective tools to improve maximum force production [2, 17]. Regarding the ‘horizontal versus vertical’ argument, one may discuss the use of extremely heavy horizontal exercises (sled push for strength, prowler push) as a replacement of traditional compound lifts. Although training programs are never so black and white, I’d like to see a research group really probe the difference in performance outcomes following either horizontal- or vertical-dominant training programs.

Force-velocity curve and RSS training

The balance between how load influences force and velocity can determine long-term adaptations to RSS training. Figure 2 proposes a force-velocity (FV) curve for resisted and assisted sled sprinting.

Proposed Force-Velocity Curve for Resisted and Assisted Sprint Training

Figure 2. Proposed Force-Velocity Curve for Resisted and Assisted Sprint Training


I have a problem with FV curves that are built without a ‘specific’ action in mind. The terms ‘strength-speed’ and ‘speed-strength’ are meaningless when used in isolation. ‘Strength-speed’ pertains to: “higher force, lower velocity than X”. ‘Speed-strength’ is the opposite: “lower force, higher velocity than X”. Without X, we have nothing. I believe an FV curve should revolve around the ‘specific’ sporting action one is trying to improve. In this case, our sport-specific action is sprint acceleration.

The proposed force-velocity curve centres on unresisted sprinting. ‘Strength-speed’ and ‘acceleration-speed’ involves an overload of the force component and reduces movement velocity. ‘Speed-strength’ and ‘speed’ work increases the velocity component and does not challenge peak force production. In agreement with previous FreelapUSA articles (The Sled: Resisted Sprint Training Considerations and Resistance Run Training: Thoughts, Observations and Guidelines), to run fast, you must train fast – likely > 90-95% of the best time for a given distance. As aforementioned, I do not believe RSS training with light loads adds a sufficient stimulus above that of URS training alone. Why go to the hassle of adding a sled when a standard URS session will do the trick? Therefore, true sprint speed training takes place below the threshold line. Speed training is not prescribed above the proposed threshold. Above the threshold, we are prescribing skill-practice and strength/ power training. As with the majority of sporting movements, performance can be enhanced by training at varying parts of the curve depending on individual athlete requirements.

Acute Program Variables

I wish to be conservative with recommendations when discussing intensity, volume and rest periods. Unless one has an excellent understanding of the athlete, the concurrent training and program goals – it is difficult to prescribe effective acute variables. Therefore, I have provided a range of options in Figure 3. These options are based on 11 peer-reviewed papers [3] and three years of UCD High-Performance Gym data.

General Acute Variables for RSS Training

Figure 3. General Acute Variables for RSS Training


Long-term improvements in sprint performance following RSS training likely requires >2 sessions per week for > 4 weeks [3]. Acute variable selection for RSS training (Figure 3) differs little from that of traditional power training. Higher intensities require lower volumes and vice versa. An athlete may initially experience neural adaptations such as improvements in trunk lean during URS and a subsequent improvement in the angle of force application during URS – although more research is required to test this hypothesis. Given the high importance of horizontal force application to sprint performance, neural adaptations may be the most favourable benefit of RSS training.

Sprint training adaptations are distance-specific [2]. For example, if sprint acceleration is the goal, I’d recommend working between 10 and 20 m with the appropriate sled load. UCD athletes have shown an ability to maintain 0-20 m sprint acceleration for 5-8 repetitions at 80% maximal resisted sled load (MRSL) and 10-12 repetitions at 30% MRSL. I generally prescribe RSS volumes based on these data as once an athlete begins to decelerate, the movement quality and power output have already declined.

If improvements in sprint speed are the key goal, I recommend never to ignore true speed training i.e. unresisted sprinting. Adaptations are specific. Heavy sled sprints will not make you slower, ignoring true speed training will make you slower! I truly believe that the most efficient transfer of RSS training to URS performance is achieved when both variations are performed within the same session. RSS efforts allow the athlete to understand exactly what trunk lean and horizontal application can feel like. Successive URS efforts allow the athlete to (a) attempt to physically transfer the feeling of RSS trunk lean to URS and (b) run fast and feel fast. RSS training may a potentiating effect on URS performance, but this is still in debate [18-20]

Your coaching eye is vital to RSS training. Like any exercise, a complete breakdown in RSS form and movement quality is unlikely to provide an effective motor pattern or speed/ power stimulus. Adjust your acute variables accordingly and don’t be afraid to swerve away from the planned session. Be a coach.

Cueing

RSS training provides the opportunity to continue emphasising your usual technical sprint cues. Whether you prefer internal or external cues, they can be directly applied to RSS training. As heavy RSS efforts are slower than traditional sprinting, athletes may find the ‘slow-motion’ of RSS useful to practice a specific cue. Cueing an athlete to “explode” from the start may be useful, especially given the extra effort required for initial acceleration at heavy RSS loads. This type of cue during heavy RSS efforts may also help increase long-term peak total and horizontal RFD and peak power. If the athlete understands RSS training is about trunk lean or horizontal force application, the athlete may try to exaggerate their forward lean during the sprint. This often leads to miss-stepping and a stutter-like sprint. I often ask these athletes to “allow the lean”, rather than “force the lean”. Finally, it goes without saying that athletes should be encouraged to provide maximum effort to RSS training.

Summary

  • Resisted sled sprint training is a ‘specific’ method for improvements in sprint performance.
  • Depending on sled load, long-term adaptations to RSS training range from decreased braking forces, an increased trunk angle, greater horizontal application of force and improvements in the rate of force development. These adaptations combine for greater sprint speed.
  • Although RSS training is effective for improvements in sprint performance, it is just one very small tool in the toolbox. General or ‘non-specific’ exercises, lifts for maximum vertical force/ power and true speed training are vital elements of an athlete’s physical training program.
  • If the goal is to improve sprint performance, do not forget to program for true speed work i.e. unresisted sprinting.
  • When planning RSS sessions, coaches must manipulate load, repetition distance, session distance, cues and concurrent training to achieve eventually the desired adaptations.
  • Unresisted sprint coaching cues can be used directly with RSS efforts.

All papers mentioned in this article can be found here.

Acknowledgements

Thank you to Dr Eamonn Flanagan and Dr Brendan Egan for providing feedback for this article. A huge thank you to Maria Monahan of whom continually researches, applies and challenges RSS work at UCD High Performance.

Please share so others may benefit.


References

  1. Seitz LB, Reyes A, Tran TT et al. Increases in lower-body strength transfer positively to sprint performance: A systematic review with meta-analysis. Sports Med. 2014;44(12):1693-702.
  2. Rumpf MC, Lockie RG, Cronin JB et al. The effect of different sprint training methods on sprint performance over various distances: a brief review. J Strength Cond Res. 2015.
  3. Petrakos G, Morin JB, Egan B. Resisted Sled Sprint Training to Improve Sprint Performance: A Systematic Review. Sports Med. 2015.
  4. Young WB. Transfer of strength and power training to sports performance. Int J Sports Physiol Perform. 2006;1(2):74-83.
  5. Rabita G, Dorel S, Slawinski J et al. Sprint mechanics in world-class athletes: a new insight into the limits of human locomotion. Scand J Med Sci Sports. 2015;25(5):583-94.
  6. Morin JB, Edouard P, Samozino P. Technical ability of force application as a determinant factor of sprint performance. Med Sci Sports Exerc. 2011;43(9):1680-8.
  7. Morin JB, Bourdin M, Edouard P et al. Mechanical determinants of 100-m sprint running performance. Eur J Appl Physiol. 2012;112(11):3921-30.
  8. Buchheit M, Samozino P, Glynn JA et al. Mechanical determinants of acceleration and maximal sprinting speed in highly trained young soccer players. J Sports Sci. 2014;32(20):1906-13.
  9. Weyand PG, Sternlight DB, Bellizzi MJ et al. Faster top running speeds are achieved with greater ground forces not more rapid leg movements. J Appl Physiol. 2000;89(5):1991-9.
  10. Cottle CA, Carlson LA, Lawrence MA. Effects of sled towing on sprint starts. J Strength Cond Res. 2014;28(5):1241-5.
  11. Kawamori N, Newton R, Nosaka K. Effects of weighted sled towing on ground reaction force during the acceleration phase of sprint running. J Sports Sci 2014;32(12):1139-45.
  12. Martínez-Valencia MA, Romero-Arenas S, Elvira JL et al. Effects of Sled Towing on Peak Force, the Rate of Force Development and Sprint Performance During the Acceleration Phase. J Hum Kinet. 2015;46(1):139-48.
  13. Maulder PS, Bradshaw EJ, Keogh JW. Kinematic alterations due to different loading schemes in early acceleration sprint performance from starting blocks. J Strength Cond Res. 2008;22(6):1992-2002.
  14. Lockie RG, Murphy AJ, Spinks CD. Effects of resisted sled towing on sprint kinematics in field-sport athletes. J Strength Cond Res. 2003;17(4):760-7.
  15. Cronin J, Hansen K, Kawamori N et al. Effects of weighted vests and sled towing on sprint kinematics. Sport Biomech. 2008;7(2):160-72.
  16. Nogueira M, Viriato N, Vaz M et al., editors. Dynamometric analysis of resisted sled on sprint run. ISBS-Conference Proceedings Archive; 2011.
  17. Okkonen O, Hakkinen K. Biomechanical comparison between sprint start, sled pulling, and selected squat-type exercises. J Strength Cond Res. 2013;27(10):2662-73.
  18. Whelan N, O’Regan C, Harrison AJ. Resisted sprints do not acutely enhance sprinting performance. J Strength Cond Res. 2014;28(7):1858-66.
  19. Smith CE, Hannon JC, McGladrey B et al. The effects of a postactivation potentiation warm-up on subsequent sprint performance. Human Movement. 2014;15(1):36-44.
  20. West DJ, Cunningham DJ, Bracken RM et al. Effects of resisted sprint training on acceleration in professional rugby union players. J Strength Cond Res. 2013;27(4):1014-8.
  21. Bachero-Mena B, Gonzalez-Badillo JJ. Effects of resisted sprint training on acceleration with three different loads accounting for 5, 12.5 and 20% of body mass. J Strength Cond Res. 2014;28(10):2954-60.
  22. Kawamori N, Newton RU, Hori N et al. Effects of weighted sled towing with heavy versus light load on sprint acceleration ability. J Strength Cond Res. 2014;28(10):2738-45.

The post The Implementation of Resisted Sled Sprint Training: Programming, Periodization and Concurrent Training appeared first on Freelap USA.

The Best Speed Workshop I Have Attended in the Last 10 Years—Or Maybe Ever

$
0
0


Sprinters in 100 Meter Block Start

By Carl Valle

Recently I had the great privilege of listening to Boo Schexnayder, one of the godfathers of modern track and field. Most coaches are aware of Boo’s impressive results at Louisiana State University, and of his great educational treats at conferences. One of my favorite documents is his PDF on strength and power construction, as he was a top jumps and multi coach at LSU. If I had to count on one hand the coaches who have influenced me the most, Boo is on that list. I have known him since 1998, and it’s amazing to see that his is craft even better 17 years later.

To say this was the best workshop I have attended in the last decade is an understatement. It’s one of the best of my life—period. What I learned was a major life milestone as every word resonated with me. All his statements were enlightening and rich in both clarity and value. If you have not attended one of Boo’s presentations, go to his website—after reading this review, of course. If you coach a college or professional team, bring him in for a day and have your brain explode.

Boo’s strength is his ability to take very complicated and even unknown phenomena in sport and make them clear without dumbing down. This presentation was packed with straightforward information and supplemented with real stories illustrating concepts that matter. I sometimes attend presentations with a lot of crap and nonsense, loaded with stock photos of abstract images. We need less exotic and “cool-sounding” trendy theories and more concrete, results-proven principles. I embrace the idea of thinking outside the box and general reading to become well-rounded, but most of the rubbish I am seeing is clickbait content to get attention rather than to enlighten. Many high-level coaches use the latest “book of the month” to distract readers in order to hide. Listening to Boo is revitalizing, as many coaches have become used to smelling BS for so long that the fresh outdoors is an unknown scent.

I will share what popped into my head and bet the farm that everyone in speed and power sports will find both some awesome information they can use “on Monday” and major principles they can use for the rest of their careers. The following four key concepts are enough to satisfy anyone who wasn’t present at the workshop. He covered other important elements, but I prefer to get into more depth rather than play around at the surface level.

One

Treating Speed as a Priority

Boo began with what must frustrate him—people want to get faster but when it comes to committing to change they don’t put their money where their mouth is. One of the great parts about the LSU scoring table—a series of benchmarks in speed and power—is that while numbers are not everything, objective improvement has a lot of merit. Not measuring important changes is putting your head in the sand and hoping for things to work out.

Speed development is a daily street fight, as every session is a constant battle to get what helps improve an athlete done. Anything will work at early levels—even getting older in high school—but as athletes have a few years under their belts genetics become stubborn. Boo recounted how people ask for help, and he shares his wisdom, but they veer off the path and fail to improve because the priority is lost. My concern with GPS use is the lack of understanding of speed development rather than looking for fatigue. If athletes are losing speed globally and generally, coaches often yield to the temptation to rest instead of making the program smarter.

In 2003, a debate between Tom Tellez’s work and vertical integration emerged. The terminology S2L (short to long) and L2S (long to short) was all the rage. Since I was part of the christening of the content (read the Forum Review), I am to blame for some of the confusion. The idea of doing short sprints and building out length is 100 years old. The refinement started in the 1960s and 1970s with Gerard Mach and other great coaches. Focusing on short sprints and extending the distance over time is a poor summary of a training program and I was wrong several times.


Reducing a running or sprinting program to distance-only is misleading.
Click To Tweet


Nobody does a pure program, and reducing a running or sprinting program to distance-only is misleading. Progressions in distance are interesting, but many L2S programs do block work that is fast early in the season—and categorize it as technical work! Just because one is focusing on changing one part of a quality doesn’t mean other qualities are not improving or interfering with a development process. I have been burnt since the 1990s thinking that getting copies of workouts and visiting coaches was enough to decode training programs. I am now 38, far removed from the 22-year-old wanting to see what made Mo Greene great. Beyond hunches, I still don’t know why some of my athletes fail to improve or break school records.

  1. In addition to the taxonomy of training challenges, non-visual changes to the body from underlying neuromuscular systems are a factor. An example is programs that work on strength and power in the weight room while doing general conditioning runs coupled with plyometrics. A running program that stays the same and slowly speeds up is not S2L, but the plyometric program and weights still affect acceleration abilities.
  2. A good perspective is thinking about how acceleration is always included in any running program. A slow tempo session using fast acceleration may not achieve fast top-end velocities. The first 15-30m at 90% effort before striding out at 16-second 100s isn’t about length; it’s about what happens in the distance. I think as we start looking at what people actually do from a body velocity perspective per repetition, we can discern more. Otherwise, it’s a labeling problem we will continue to suffer.
  3. I like the simplicity of P.J. Vazel’s 2008 presentation on his training of African 100m record-holder Olusoji Fasuba. He urged coaches to focus on tallying what people do regarding themes and type of work, rather than on periodization or training theory. When training theory takes over the conversation, people tend to forget it’s not about secondary relationships rather than the primary influences of the work done.
  4. Most coaches know the value of short sprinting reducing risks to soft tissue, specifically the hamstrings. I like Boo’s suggestion that three-point or crouch starts help fold the hip joint and encourage an unfolding action to preserve the knee joint. I do more standing starts as I find them to be beneficial to testing though I may throttle down with soccer next year.
  5. Multi-throws encourage unfolding but only if coached correctly. Countless people perform medicine ball throws, but the timing sequence is very difficult to pick up with the naked eye. Only 1 of 100 coaches is blessed with great vision to see this, and usually, the other 99% have egos that make them unaware they are not gifted. I have done EMG, motion capture, force plates, and embedded sensor medicine balls. Many athletes don’t create a summation of forces correctly. It takes time and many either don’t do enough reps or spend a lot of time doing junk reps of the wrong stuff.

It makes sense to count the speed sessions of actual sprinting and ask, did one devote time and effort to getting faster? Conditioning is often neglected and I understand how just being fit matters, but Boo calls junk running without being prepared “piling on overuse rather than contrasting.” Coaches doing tempo running are not idiots, but they must be careful not to do too much. Boo suggests general circuit-style training to improve fitness by distributing the stress in non-specific forms rather than orthopedically overloading the body with movement stereotypes.

Two

The Need to Contrast Training

A recurring theme is long competitive phases and short preparation periods. The problem with modern sport is the cultural and economic challenge of facing the plight of over-competing and underpreparing. A good solution and valuable principle are to factor in what the athlete is getting from competition and see what can be contrasted with training. Two primary challenges exist: the need to support competition with intensity, and the lack of time to do it. What usually happens—especially in the NBA—is a focus on recovery and regeneration when the problem is that athletes are not contrasting. Maybe the GMs should hire the players’ moms to help with recovery. That way, athletes can be spoon-fed the right nutrition and get tucked in at night. While “parental guardians” is a bad joke by some NBA coaches, the real challenge smart coaches face is getting athletes to train hard before and during the season in the weight room.

At the USATF Level 2 School in 1998, Boo suggested doing more vegetative work with circuit-style wellness routines. Recently Dr. Mike Stone brought up on Twitter that circuit training was only for adult fitness or sissies. He is right because circuit training is not a primary stimulus. It plays more of a supportive role. Vegetative work can be thought of as parasympathetic-type activity, and circuit-style training elicits a rhythmic pulse to the body. Circuits are old methods of organizing fitness, and Boo has suggested them as a way to replace the need for tempo training or repeat grass running.

My point of contention is that while many talented athletes run gracefully, others don’t have their stride fall into place by just doing speed work. I am a middle-ground guy who feels it’s good to do tempo running once a week during the season and doesn’t cut it out unless athletes have a good stride. Pure sprinters don’t need to worry about running fitness, but 400m runners need it as no sub-44 man has come from a diet of circuits only. Soccer and longer endurance sports shouldn’t learn from sprint programs that remove running, as it’s not translatable.

Boo explained that to increase the intensity of work, one has to reduce the number of quality sessions so the power or speed can rise from resting enough. In addition, increasing lower-intensity sessions similar to the CFTS theory makes sense, since the absolute quality forces coaches to be more patient when deciding to go hard again.

Back to the earlier statement about standing versus crouched or three-point starts—big hip ranges and large amplitudes can help contrast shorter specific work. I still think multi-throws are excellent vehicles for range of motion, but due to the ballistic contractions, I don’t see how they coordinate the “rebooting” characteristics discussed in some circles. Doing explosive work on recovery or lower intensity days is possible, but only so many elite athletes have the capacity to do other people’s workouts as their “easy” day.

Squatting and Olympic lifting (which Boo calls “harmonizing agents”) percentages are very touchy, and it was interesting to see the number of repetitions and the loading Boo utilizes. I think Boo’s idea of summarizing training as types of tension work is important. Lifting after high intensity sprinting and plyometrics may work with lesser loading once an athlete has achieved the 180–200-kilo squatting milestone (75-85 kilo-size athlete).

In 2006, Gary Winckler presented an amazing finding on effective ways to increase the impact of training programs by listing contrasting ideas to increase the penetration of a stimulus. I have used his groupings and found the results were stronger in the long run than potentiation work, as entire seasons of great training are better than a few sessions of specialized weight or speed work.

Three

Lactate Training Design

In the 1980s, the ASCA world books highlighted some awesome concepts on lactate, and recently some coaches have taken a strange stance on the interpretation of Martin Gibala’s studies with acidosis and fatigue. Since about 2006, several blogs and online and print articles have promoted “cargo cult” science nonsense and delayed the evolution of conditioning. Additional questionable sources of information on the aerobic system have caused coaches to attempt workouts that no human being, not even the elite, can successfully improve from.

Lactate conjures up a lot of misinformation. Some people think it’s a near-potent biochemical response while others seem like they think blood is going to melt one’s muscles like the movie Alien if the workouts are too hard. Of all Boo’s concepts, this one needs some contextual background and an understanding of the endocrine system beyond basic physiology books.


Lactate is not good or evil; it’s just a KPI of response to training.
Click To Tweet


Many coaches don’t know how to condition the explosive athlete, as conferences often bring endurance gurus and hope the Ironman expert will somehow find a way to connect his or her experiences with fourth quarter fatigue in the NFL or NCAA football. All of the crap out there is based on nearly useless information unless one understands the continuum and figures a way to extract the good grain from the chaff. Most adaptations are invisible to the naked eye and must be taken with a grain of salt. But just because the adaptations are invisible doesn’t mean they are not happening. Because they are not observable, that creates space for guru nonsense. Here are some less-explored areas talked about on social media. When publicly asked to elaborate, the pundits escape or suddenly become busy:

  • Ventricle hypertrophy
  • Enzyme induction development
  • Mitochondrial biogenesis
  • Capillary density of muscle fiber

I vigorously chanted these concepts in 2002. After spending a small fortune to see if they occurred in team and speed athletes with conventional training, I found they didn’t! Sure, an elite tour cyclist will increase hemoglobin mass, but sometimes even they do not. Expecting an EPL soccer player to be the next Miguel Indurain is just wishful thinking. The constraints of the calendar dictate meaningful, worthwhile changes, not Eastern Bloc periodization models.

  • The size and strength of the heart are mainly based on time and effort, and it has taken me years to see structural changes. It’s humbling and crushes the ego when 36 weeks of work may move the needle a millimeter in wall thickness. When I hear 8-week offseason phases with 3 “blocks” are building elephant hearts, I get annoyed. It requires very strong legs and 80-120 aerobic workouts to push the envelope over years, not weeks or even months.
  • Enzymes are interesting but with seasons changing, the moving targets of enzymes are a hard goal. Enzymes are simple chemical compounds that break down substrates and materials. That is all. Often “catalyst” is used to show that enzymes speed up reactions, but in sports training, they help do the job the coach is stressing on the body. Like nearly all components of training, it’s a case of use it or lose it.
  • Dudes on Twitter need to calm down on mitochondrial adaptations, specifically how HIIT increases new organelles in the body. Like any quality, it’s hard to maximize it without making it a priority, and I have not seen anything that shows actual biopsy changes. Muscle sampling to gauge changes is not expensive but highly invasive. Hopefully bright guys like Landon Evans can find non-invasive ways to estimate where the contributions in adaptation are occurring.
  • Capillary changes in explosive athletes are elusive since Type I fiber volume decreases as the athlete becomes more genetically gifted. Finding a way to condition athletes without increasing overall fatigue is challenging since genetically gifted athletes have less cell space for morphological changes. Coaches with blessed talents must be even more conservative and patient without babying the athletes. When in doubt think “work the heart and lungs” while “resting the nerves and joints.”

Boo explained that the progression and need of slow cooking the tolerance to pH disruption workouts are vital to speed development. I agree. When blood pH drops from acidosis, this is a dramatic change to body homeostasis and must be carefully ramped up, or the body rejects the input. Having an athlete throw up is not something to be proud of. Boo explicitly warned that the neuromuscular system isn’t a fan of lactate workouts and labeled the stimulus an irritant.

I am not sure if the utopian high-performance model has changed with regards to lactate from saturation approaches. A good model is time and manipulating density. I have found the approach of “produce, reduce, and use” to be a good outline. High lactate levels should not be indicators of effort, just like a slob having a high heart rate because he is out of shape and doing something marginal. Lactate clearance is also an incomplete picture since low speeds and low mmols show a specific adaptation. The milestone “use” is when enzymatic function is high enough that the body is more successful in force production (cross-bridges) and toughness.

The more time an athlete is producing high-power output, the rise of lactate (from a drop in blood pH) will create very unique adaptations to the body. Coaches can reduce rest slightly or do more and cheat (read “fool the body”) into eliciting higher acidosis levels without dropping power output. A slight dip in rest times still creates a window in which athletes can continue to hammer out speed and make possible morphological changes. When Dan Pfaff shared his Texas data on lactate, I thought either he was mistaken or onto something. I bought a new meter, and he was right. Lactate is not good or evil; it’s just a KPI of response to training.

Boo shared important endocrine and myokine information about how simple things like bodybuilding rep schemes create unique responses that coaches can leverage, especially during heavy training and competition phases. Most people assume that because gene activation models and satellite cells are in vogue, acute and transient endocrine changes are a temporary response.

For example, lasting mood changes from the endorphin response of a good pump are not just for Mr. Universe. It may be an ethical way to handle heavy loading and deal with eccentric overload. Remember that IGF-1 and the other markers in its family can increase basally if sufficient calories are consumed, but excessive eccentric work makes glycogen restoring difficult. Circuits can help do more than keeping people lean. The benefits of getting higher repetition work remove staleness and the long-term adaptations can be seen on HRV monitoring data.

Overall, the appreciation that lactate response is a simple element that can be periodized over time must be factored into training. The duration and intensity will influence the lactate effect of the session, and the time in the season will dictate how those responses affect the body as well. Lactate is a signal to the body analogous to wind—it can make you sail faster or capsize you. Acidosis is not an advantage, though, and new schools of thought are dismissing what happens to biochemical reactions of low blood pH. If used properly, lactate responses with and without running can improve the adaptation rate in training.

Four

General Neuromuscular Adaptations

Without sounding negative, my fear is that many coaches are interested in sports medicine areas out of their role and not reading fundamental texts like Strength and Power in Sport (Paavo Komi) or something contemporary as Multiple Movement Systems: Biomechanics and Movement Organization (Jack Winters and Savio Woo). Some misinterpretation is also a problem when young coaches fail to comprehend the materials properly, so it’s better to read the foundational materials multiple times rather than tweet photos of books one does not properly understand.

Boo hinted that a solid approach is to think about tension on tissue and what changes are happening at the cellular and system levels. My concern is that the “movement quality” peanut gallery is vocal but vague with adaptations and what changes from real training. One can cue all they want, but if the horsepower and transmission aren’t there, a leather steering wheel isn’t going to help much. Coaches may want to brew a pot of coffee, read Roger Enoka’s Neuromechanics of Human Movement, and ease up on the motivational speaking books.

Neuromuscular adaptations are not going to change when the endocrine system is shot and too little absolute training is performed. Boo was emphatic about windows and thresholds of work that must be done to drive or augment the qualities that improve coordinative changes. What was interesting is the stark difference in classic training inventory of jumping, throwing, lifting, and sprinting modalities still used, and some schools have moved to “functional training.” I am not sure how elite athletes are going to rise from the primordial goo of single-leg cleaning up stairs and running with barbells above their heads, but I will trust 40 years of podium performers.

Inter- and Intra-muscular Adaptation – Firing routines in the body can improve when enough skilled repetitions are completed. Boo focused on the need and the necessary removal of remedial exercises based on the needs of a season. Many coaches including myself do a lot of remedial work in fear that athletes might lose their motor skills. Boo covered the essential neurophysiology of how muscle groups coordinate and how motor units align with regards to timing. His training inventory—a classic menu of indispensable tried and true exercises—should be a staple. It is a great overview of what many coaches have found to work.

High Threshold Motor Units – Absolute work is needed, and this is one of the reasons team sports get injured. I had a debate with a “movement screen” proponent, who argued that strength training doesn’t work because the NFL is full of strong athletes and yet injuries are not decreasing. I responded that those with a particular approach to athlete appraisal in function are not demonstrating any statistical impact on health, and their promoted NFL team always was in the bottom of the non-contact injury rankings. Hamstring research has shown that weakness is a bigger risk than asymmetry, as the body coordinates and harmonizes what it has rather than being lost without power.

Coordination and power are not mutually exclusive, but doing silly weight exercises with medium speeds and low loads is a compromised modality that leaves us with neither adaptation. Improving the recruitment of more explosive fiber will show up in technique as many errors are not technique, just an absence of power. Both control and raw horsepower can help the elderly, so seniors should do dancing and ballistic power training to stay healthy and young.

Coordination with Summation of Forces – Summation of forces involves using as many joints as possible to create maximal output. Some timeframes and motions are limited, but the goal is leveraging total body motions to drive neuromuscular adaptations. Boo shared how athletes working with coach Gayle Hatch in Louisiana made big improvements in all power indices by adding high RFD stimulants like plyometrics to their programs, and their lifts went up even further. Summation of force principles is especially useful for coaches wanting to change neuromuscular adaptations and add a safety buffer by protecting connective tissue.

Possible Brain Adaptations and Neurochemical Shifts – I have looked at the neurochemistry of athletes, and it’s freaking expensive. My heart and personal wallet took a hit when I wanted to see changes to the body. The blood-brain barrier is more complicated than I expected, so like most people I refer to specialists. At the NSCA conference in 2000, I asked Dr. Bill Kraemer about theoretical changes at the neuroendocrine level. Being more of a plumber myself, I wanted to know how more “current” was shifting at the chemical and structural levels. Not wanting to get stuck with citations of hummingbird motor neurons and salamander muscle experiments, I think we need to see more of David Bishop’s RSA data that looks at interactions from the brain down to the organelles. I think the cytokine CNS fatigue model is relevant and has some merit, but currently, no model is complete in explaining how people fatigue and adapt with neurochemical status.

In summary, the general training to tissue has a lot of absolute benefit to the body and a capacity to improve specific needs if both ends are trained. Practices are getting the main conversions and transfer stimulants and coaches need to remember to contrast what the athlete is getting too much of instead of piling on more work that will be redundant.

Boo’s Education and Resources – Getting Informed

For nearly two decades, Boo has always been patient when I ask repeated or common questions. Most of my biggest achievements in coaching—state records, All-American performances, and sending people to the Olympics—are a result of USATF education and Boo. He is an especially great resource for all coaches wanting to get results and learning timeless information.

Boo’s website is SAC Speed.

  • Read and watch everything he has written and shared. Period. Don’t be cheap. Make his educational resources a priority, just like making speed a key principle.
  • Attend a presentation in person. He is open and generous with his time but don’t abuse it. I strongly suggest taking the man out for food!
  • Finally, if you are a professional or college team, don’t fly your staff to a lame conference with “speed experts.” Instead, invest in flying Boo in. I don’t know his cost, but it’s worth every penny.

Please share so others may benefit.


The post The Best Speed Workshop I Have Attended in the Last 10 Years—Or Maybe Ever appeared first on Freelap USA.


Barriers to Championship Performances

$
0
0


Dan Pfaff Coaching at ALTIS

ALTIS and Freelap — two of the biggest names in T&F — have come together to celebrate progress in our sport. We hope you enjoy this week’s blog post. Share if you enjoy it!

By Dan Pfaff, ALTIS

The below are a collection of thoughts and observations acquired through 40 plus years of coaching and interaction with Championship Performers from across the globe. Championship Performance is no easy feat … I hope some of these points may offer clarity on the reality of what it takes:

  1. Risk taking is a common trait among champions. Learning to be comfortable taking calculated risks to drive positive change – whether that be in mindset, mechanics, strategies, tactics or training methods is essential. Perpetual residency in the familiarity of comfort zones and associated risk avoidance will consistently blunt your progress. If you want to be a Championship Performer, get comfortable being uncomfortable.

  2. Learn to be comfortable taking calculated risks.
    Click To Tweet


  3. Believing there will be a perfect jump, run, or meet is a deadly trap that slowly becomes a virus. Attachment to perfectionism wrecks not only competitions but practices – and ultimately one’s life balance. Any analysis of a World Record effort will yield numerous flaws and detractors from the athlete’s better performance cluster.

  4. Believing there will be a perfect jump, run, or meet is a deadly trap that slowly becomes a virus.
    Click To Tweet


  5. Self-talk is powerful – both in a positive and negative vein. What you think and say to yourself evolves into patterns; these patterns become habits, and eventually drivers for your practices, competition, and life duties. Closely related to this is body language: If you project defeatist traits, they will drive everything you do.

  6. Self-talk is powerful - both in a positive and negative vein.
    Click To Tweet


  7. Lip service is plentiful. Folks always claim they are all in. They talk and dream about being at the top, yet few study those at the top and note what it truly takes to be there. Elite performance involves deep study, endless efforts, honesty on all fronts, and accountability beyond the norm.

  8. Elite performance involves deep study, endless efforts, and accountability beyond the norm.
    Click To Tweet


  9. Elite performance evolves over time. Tools, tactics, mindsets and behaviors that worked in the past must change as situations increase in demand. Living in the past with these factors is a one-way ticket to frustration – both for you and those around you.

  10. Behaviors that worked in the past must change as situations increase in demand.
    Click To Tweet


  11. Selective energy use will result in gaps during pressure performances; less than mindful and purposeful attention to detail in all work tasks creates these gaps. Everything you do daily has a purpose and intent – just ticking boxes does not ensure understanding or efficacy.

  12. Just ticking boxes does not ensure understanding or efficacy.
    Click To Tweet


  13. Many people stay in a situation because they are fearful of the next chapter. Viruses in mental and spiritual growth manifest when one treads water, waiting to muster up the courage to take the next step, or to change paths from the route they are currently treading.

  14. Many people stay in a situation because they are fearful of the next chapter.
    Click To Tweet


  15. Communication is oxygen to relationships. The inability to express your thoughts, moods, concerns, boundaries and desires create a slow death in any relationship you are involved in. Learn to communicate, or any relationship will inevitably be short-lived.

  16. Communication is oxygen to relationships.
    Click To Tweet


  17. Enjoyment of the journey is critical in all endeavors. One must find ways to enjoy every step of the climb: Why climb the highest peaks to stare at the crevice in front of you rather than turning to see the majesty of the view from the top?

  18. Enjoyment of the journey is critical in all endeavors.
    Click To Tweet


  19. Champions love puzzles. They can’t wait to get to work the next day to find solutions. They embrace failure, for it acts as a springboard to solutions. Work is play for them.

  20. Champions embrace failure, for it acts as a springboard to solutions.
    Click To Tweet


  21. Failure is embraced by leaders in all walks of life. It does not paralyze; it does not diminish risk taking; it does not color behavior: It is a catalyst for problem-solving.

  22. Failure is embraced by leaders in all walks of life.
    Click To Tweet


  23. Champions know how to network and use networks. They are on a never-ending search for answers and solutions. They all have a gatekeeper for this search engine – a person they use for wisdom, guidance and advice when utilizing networks and network inputs.

  24. Champions know how to network and use networks.
    Click To Tweet


  25. Champions see the big picture and do not get hung up on minutiae: They are resilient and anti-fragile in nature; they realize there are many roads to Rome. At the same time, they respect that there are principles, theories and accepted practices in their area of expertise.

  26. Champions see the big picture and do not get hung up on the minutiae.
    Click To Tweet


  27. Champions embrace and accept constructive criticism. They crave systematic feedback. They keep detailed records of their journey, and they frequently review how often they receive these criticisms; looking for patterns that lead to the elimination of said faults and behaviors.

  28. Champions embrace and accept constructive criticism.
    Click To Tweet


  29. Champions pay attention to detail and never tire doing the fundamental tasks that support their endeavor. They find enjoyment and stimulation in the most mundane tasks. Repetition does not bore them.

  30. Champions pay attention to detail and never tire doing the fundamental tasks that support their endeavor.
    Click To Tweet


  31. Champions strive for balance and excellence in all areas of their life. Whether it be at work, in relationships, in the community, or self-analysis. They are always pushing boundaries, limits and currently accepted ceilings, created by themselves or others.

  32. Champions strive for balance and excellence in all areas of their life.
    Click To Tweet


  33. Champions know how to build out conditional, seasonal, and state of health metrics for practice and competition-cluster analysis. Knowing how each Key Performance Indicator is progressing during various phases of the year, and in varying conditions and state of health, are practical, healthy ways of managing expectations and predictions.

  34. Champions know how to build conditional and seasonal metrics for practice and competition-cluster analysis.
    Click To Tweet


  35. KPI analysis is an ongoing, never-ending process in organizations that exhibit excellence. The number, scope, and type of KPI factors change with evolution and the training year.

  36. KPI analysis is an ongoing, never-ending process in organizations that exhibit excellence.
    Click To Tweet


  37. Champions have many tools in the toolbox for practice and competitions. They realize that trying harder, going faster, or getting emotional may have worked at an early stage of their career, but these tools no longer work at the elite level.

  38. Champions have many tools in the tookbox for practice and competitions.
    Click To Tweet


  39. Champions understand the arousal curve for performance exhibition. Through experimentation in training and at meetings they find a zone to operate in when under pressure, or sub-optimal conditions. They are flexible with this zone and know how to adjust KPI factors accordingly. It is an art.

  40. Champions understand the arousal curve for performance exhibition.
    Click To Tweet


Successful Championship Performance is a finely tuned skill requiring years of practice, along with the ability to calmly ride out the multiple peaks and valleys of frustration that will inevitably occur along the way. I hope some of these points may have resonated and will aid you on your journey.

Best of luck with your endeavors,
Dan.


SimpliFaster Exxentric kBox

The post Barriers to Championship Performances appeared first on Freelap USA.

How To Improve Front-Side Mechanics and Force Production with the Wicket Drill

$
0
0


Athlete Sprinting Over Speed Hurdles in the Wicket Drill

By Mario Gomez

We use wickets with our sprinters, hurdlers, jumpers, and distance athletes. Here is how we implement them within our program. Regardless of the type of systematic approach your program follows, wickets should be a part of your coaching toolbox.

The speed hurdles used in these videos were built using the material and instructions described in the article “How To Build Speed Hurdles for the Wicket Drill.”

Spacing Requirements

The settings described here are only suggestions. It’s up to each coach to play around with spacing based on skill of the athletes, time of the season, and mastery of the drills.

Basic Wicket Drill

I stole this drill from Marc Mangiacotti, assistant men’s sprint and hurdles coach at Harvard. He also serves as horizontal jumps coach.

We use this drill with all of our sprinters who have not truly sprinted in the fall. It resembles the end of a 400. As athletes prepare for fly 10s, we use this drill as a precursor to the workout.

We set up nine wickets. The first 3 are spaced at 1.45 meters (4’9″), the next 3 at 1.52 meters (5′), and the last 3 at 1.59 meters (5’3″). The athletes have a 4–8 step lead-in with no marks and starts sprinting at sub-maximal speed. While sub-maximal sprinting sounds like a contradiction—I know Coach Tony Holler will frown at this description—it allows the athletes to understand and experience the drill for the first time. As athletes get faster, the more difficult it is to coordinate all the movements involved in sprinting during max velocity.


Video 1. Example of Basic Wicket Drill

Wickets with a 6-Step Lead In

Matt Gifford recently wrote, “The Acceleration Ladder” for Freelap. The article explained the purpose and usefulness of the “stick drill.” He discussed distance settings for proper acceleration mechanics, based on individual differences such as physical makeup, skill, power, and time of year. For the wicket drill, we provide similar settings for the first six steps based on the initial spacing between the 1st and 2nd wickets. These initial settings are also determined by skill level, training age, time of the season, surface, and other factors. Don’t be afraid to fail and start with different settings.

Vince Anderson, the assistant track coach at Texas A&M University, describes the spacing of the first six steps: “Logic would dictate that the stride length over the first hurdle is exactly the same as the space between the first two hurdles, with ground contact dead in the middle of hurdles 1 and 2. Each run-in step, working back toward the origin, is reduced by 3 inches. Athletes should hit every piece of tape on the run-in and over the first hurdle.” His last words must be understood so the drill isn’t ruined before it even begins. The tape or mark Coach Anderson refers to asks athletes to push their hip over and allows the shin to push back into that mark. If athletes are casting out over the tape, acceleration is done. Latif Thomas, president and CEO of Complete Track and Field, says, “Once the toe lands in front of the knee during acceleration, YOU’RE done.” Make sure athletes don’t make this error during the first six steps in the acceleration of the drill.

As mentioned earlier, each coach will have to play around with spacing and distance. For the purposes of this article, I will show the settings we normally use when we introduce wickets at practice after the basic wicket drill, specifically for freshman boys or newbie sprinters. We set out ten wickets. Eventually, we add five more with the distance spacing continuum and ultimately bring the total to 20 to 21 wickets.

Since the distance between the first set of wickets is 5′, use this setting to space out the first six steps using cones, discs, or tape. If the drill is performed ideally, the athlete will land in the middle between wickets 1 and 2. Using this mark, the coach counts back five feet toward the start to mark the 6th acceleration step. Following the advice of Coach Anderson, each remaining step to the beginning will be reduced by 3″.

Therefore, in the case of having a distance of 5′ for the first set of hurdles, the acceleration steps would have the following marks: 1=3’6″, 2=3’9″, 3=4′, 4=4’3″, 5=4’6″, and 6=4’9″, followed by the first wicket placed 2’6″ after the sixth acceleration step to begin the spacing for the remainder of the wickets. Adding all the acceleration marks (24’9″) and 2’6″ (half of 5′) for the first wicket the total distance from the start to the first hurdle is 27’3″.

The first distance setting between the 1st and 2nd wicket for freshmen boys is 5 feet. The next set of wickets, 2 and 3, will also be 5 feet apart. For the next set of wickets, 3/4, the distance will increase by 3 inches (to 5’3″). Just as the distance between 2/3 remains the same as 1/2, so too will the distance between 4/5. Hurdles 5/6 and 6/7 will again be increased by 3″ to 5’6″. After 6/7 the setting is increased by another 3″ to 5’9″ through the next three sets of wickets (7/8, 8/9, 9/10) as opposed to only two sets earlier. Moving forward with wickets 10/11, 11/12, and 12/13, the distance again increases by 3 inches, to 6′.

For the next three sets of wickets (13/14, 14/15, 15/16) you only increase each setting by 2″ as opposed to the previous 3″. So the distance between 13/14, 14/15, and 15/16 will be 6’2″. For wickets 16/17, 17/18, and 18/19 the increase drops to 1 inch, meaning the settings will be 6’3″. Finally, settings for 19/20 and 20/21 again increase by 1″, to 6’4″. Below are the settings in feet and inches for 21 wickets to serve as an example for the foundation of this drill.

Table 1. Recommended Spacings for New Male Sprinters
Speed Hurdle Spacing
1/2=5′ 2/3=5′ 3/4=5’3″ 4/5=5’3″ 5/6=5’6″ 6/7=5’6″ 7/8=5’9″ 8/9=5’9″ 9/10=5’9″ 10/11=6′
11/12=6′ 12/13=6′ 13/14=6’2″ 14/15=6’2″ 15/16=6’2″ 16/17=6’3″ 17/18=6’3″ 18/19=6’3″ 19/20=6’4″ 20/21=6’4″


Video 2. Example of wicket drill with 6-step acceleration

Here is another example. Tyrone Otte, a sophomore at Chapin, recently ran a 3.29 fly 30. While I don’t want to overwhelm you with more math, this shows he could run an 11.81 100, 23.5 200, and 400 between 51.7 and 52.5. Obviously, this doesn’t necessarily mean he will, but it does give the coaching staff an indication of his potential. Based on these times, I can determine a more appropriate wicket setting.

Acceleration steps into wickets for Tyrone: The distances in parenthesis show the overall distance. For example, during acceleration step 2 the distance in parenthesis is 8’3″ to demonstrate the total distance of acceleration marks two steps away from the starting line.

Table 2. Acceleration Marks for Tyrone Otte or Acceleration Marks for developed male Sprinter
Speed Hurdle Spacing
1=4′ 2=4’3″ (8’3″) 3=4’6″ (12’9″) 4=4’9″ (17’6″) 5=5′ (22’6″) 6=5’3″ (27’9″)


Wicket marks after acceleration steps: Again the number in parenthesis represents the total distance away from the starting line. For example, wicket 1 is only 2’9″ from the 6th acceleration step, but 30’6″ from the beginning point.

Table 3. Wicket Spacings for Tyrone Otte or Wicket Spacings for developed male sprinter
Speed Hurdle Spacing
1=2’9″ (30’6″) 2=5’6″ (36′) 3=5’9″ (41’6″) 4=5’9″ (47’3″) 5=6′ (53′) 6=6′ (59′) 7=6’3″ (65′)
8=6’3″ (71’3″) 9=6’3″ (77’6″) 10=6’6″ (83’9″) 11=6’6″ (90’3″) 12=6’6″ (96’9″) 13=6’8″ (103’3″) 14=6’8″ (109’11”)
15=6’8″ (116’7″) 16=6’9″ (123’3″) 17=6’9″ (130′) 18=6’9″ (136’9″) 19=6’10” (143’6″) 20=6’10” (150’4″) 21=6’10” (157’2″)


Over the course of 6 acceleration steps and 21 wickets (27 steps), a beginning freshman—having learned how to run through wickets with proper posture a minimum of three times—will have covered 143’11”, or 43.8 meters. Compare that to Tyrone, who by simply increasing the beginning 1st acceleration step by 6″, will have covered 157’2″ (47.9 meters) over the course of 27 strides. This difference of 4 meters is huge in the world of track.


Video 3. Tyrone Otte performing wickets with increased spacing

The measuring and math for all these settings can be tedious. Coach Anderson has a chart with the available settings already configured. It uses both English and metric systems. Furthermore, Ron Grigg, director of cross country/track and field at Jacksonville University, created a 400/600/800 training program for Complete Track and Field. Included in the program is an Excel chart with metric settings that makes the process easy. When you enter the desired setting in a cell, it computes the six acceleration steps and distances up to 21 wickets. Coach Grigg increases wicket settings by 3 cm (about 1 inch) following the same continuum as described earlier.

Both charts fall within a foot of each other at the end of 27 steps, so the difference is not dramatic. For example, if I used the initial spacing of 5’6″ or 1.67 meters as previously mentioned for Tyrone, the final wicket would be placed at 157’2″ (47.9 meters) using Coach Anderson’s settings. Coach Grigg’s settings would place the final wicket at 157’11” (48.13 meters)—a difference of less than a foot.

The biggest takeaway is that every coach will have to play around with numbers and settings. Both charts make the process of putting down marks much simpler.

Complexed Wickets

ALTIS, the elite coach and athlete training environment in Phoenix, frequently posts videos of athletes sprinting through wickets on their Twitter and Instagram accounts. They recently published a video demonstrating how they use wickets. Stuart McMillian, performance director and lead sprints coach at ALTIS, posted a tweet demonstrating complexed wickets. After sprinting through a predetermined amount of wickets, athletes continue to sprint for up to 30 meters or do a fly 30.


ALTIS Coach Andreas Behm on the benefits of the wicket drill.

In his 400/600/800 meter training program, Coach Grigg also stated, “I have found great value in setting up a cone 20 meters beyond the end of the wickets and asking the athlete to keep the same technique. This is a great evaluation tool to see if they have drastic changes when no wickets are present.” With complexed wickets, a coach can time and evaluate a fly 10, fly 20 or even fly 30.

For example, in the prior example of a high school freshman boy, he would have sprinted 44 meters. Adding a fly 10 gives him more than 50 meters of quality sprinting. Again, coaches can play around with distances. A coach may only want to do 40 meters of max velocity. He could set up 30 meters of acceleration and wickets and put the fly 10 at the end as another example of complexed wickets. This is the artistry of coaching.


Video 4. Example of Complexed Wickets

Conclusion

This article describes just some of the ways in which coaches can use wickets to improve sprinting form. This summer I observed coaches in Chicago using wickets to ensure that athletes maintained a tall posture and neutral pelvis. Athletes held PVC pipes over their heads. It worked. I honestly think wicket drills are a game-changer. If they are used appropriately, your sprinters will achieve personal bests because they will know how it feels to truly sprint. If you train fast, you will run fast. The wicket drill proves that. It’s another example of coaches being as creative as possible.


Video 5. Athlete Difference sprinting with Wickets

Please share so others may benefit.


The post How To Improve Front-Side Mechanics and Force Production with the Wicket Drill appeared first on Freelap USA.

CoachMePlus: Athlete Management System for Decision Making

$
0
0


Basketball Game

By Brad Stenger, CoachMePlus

The era of sports science in the world of competitive team sports is just getting started, but the movement’s technological underpinnings are beginning to settle. Motion sensors and computer vision track athletes movement patterns and force production. New platforms for chemical sensors tell more and more about athletes’ physiological makeup. And the simple, everpresent questionnaires, anthropometric measures, weigh-ins and heart rate calculations have proven value. All of that data gets funneled into computer interfaces, and sports management moves irreversibly towards evidence- and analytics-based decision-making.

Teams will prioritize some data and ignore others. They will emphasize some results and downplay others. And they will be ready, or not, for the next-generation of sports science tech to come on-line. Those choices, for better or worse, are becoming a sports organization’s recipe for athlete performance, the secret sauce of their team’s won-lost record.

One core piece of emerging sports science technology is Athlete Management System (AMS) software (like CoachMePlus). Think of it as a scaffold for teams to build their sports science programs and their secret sauce. The increasing adoption of these software platforms speaks to the value they have for teams, but heads up, these are new products in a relatively new market.

The newness of AMS’ products has implications for customers, namely:

  • These products will change, evolve and improve.
  • A community of technically-minded AMS users will emerge, connect, and in time, grow to define itself.
  • AMS’ technical advances will lead to users’ (and teams’) innovations in workflow, analysis, and tactics as the product developers and the community make progress toward interface and usability standards.

Culture and community are forms of collaboration. (So are sales, software development, and transition defense.) Successful collaboration defines teams’ success. And collaboration will be critical to shape how teams take to an athlete management system and make it into something valuable, now and in the future.

Understanding the Athlete Management System

It’s best to know how to walk before you learn how to run. Progressions are essential for athletes’ development. And no surprise, there’s a progression for moving through the learning curve of sports science collaboration and AMS adoption.

Team sports at every level benefit from measuring athletes’ performance systematically. The decision to begin measuring starts an organization down the path of applied sports science. More sports science decisions follow, and a big one is whether to purchase and use an athlete management system or to stick with a custom solution, often assembled from Excel spreadsheets or custom databases. Either way, AMS or no AMS, the data collected and the interfaces for the athlete data are going to be as much a part of the makeup of that team as any staff member, any trainer, any player, any coach.

The athlete performance data and interfaces are an opportunity for competitive advantage; together they are the secret sauce teams use to assess talent, develop players and, ultimately, win games. The measurement technologies, in practice and from vendors, are often new and, in some cases, still emerging — biomarkers, sleep, FMS, player tracking, force plates, RPE, questionnaires, Catapult, and Omegawave.

CoachMePlus Partners

Figure 1. Vendor partners will get teams all kinds of data. Making it useful is ultimately up to the teams.


AMS software, like CoachMePlus, is, by necessity, opinionated software. It’s software with a vision and an approach for how best to get work done. CoachMePlus’ vision and approach come from the best practices of applied sports science. (Also, the opinionated-ness is not a lack of flexibility or control for users; users have both. Lots of both in fact.)

If you use Microsoft Excel or something else custom (and less opinionated) to manage athlete performance, you are in complete control of the data, it’s input, output, and management. You are the developer and the user, and out of necessity, you make lots of data management and presentation decisions. Excel is not opinionated software, and it creates more work.

Most times the decisions that get built into the user interface involve steering a user through the tasks that software has been built to help with. “Software requirements” are what software developers call these task definitions that, once built, are important elements of the software’s services. Tasks that are not defined well enough to be included in requirements documentation will not get designed into the user interface, and determining requirements is the crucial early step for building useful digital tools and services.

Having an already-built, commercial AMS helps a team to avoid starting its applied sports science program with a completely blank slate. Fill in the forms and click buttons on whatever starter template to get to a useful place with the technology. But work remains to go from starting out with the basics to making an AMS into something that reflects a team’s approach to sports science.

There can be significant advantages to going without an AMS though. The legwork in using Excel, or even paper, to manage athletes health and performance creates a useful, hands-on, personal relationship with athletes’ data. Manually entering data can be an effective, practical way to see athletes’ patterns. It is also time-consuming, sometimes to the point of being impractical for taking lots of measurements and for managing larger numbers of athletes.

Excel Spreadsheet

Figure 2. Data entry can be onerous, but it can also be a way to gain insight for whoever plugs in the numbers — coaches, trainers or the athletes themselves.


An AMS might be necessary, but it’s important to understand what it means to surrender some degree of control to an opinionated technology. It’s also important to understand what you as a software customer can do to influence, evolve and improve opinionated technology.

A team can guarantee that its data systems evolve according to its needs by developing its own systems, but the team that goes with a commercial AMS needs to remain aware of how changes in data can lead to workflow changes that might call for changes in the user interface. The task definitions that are scoped out as requirements can be inaccurate, imprecise or fail to keep up with users’ needs. It helps to remember that sports science is a young discipline, and the technologies are new.

The inability to make sense of the data takes time away from coaching, training and otherwise helping athletes. The situation is a user interface failure. Like so many efforts that do not succeed it is also a learning opportunity, a chance to examine what’s happened, apply the lessons and make progress.

CoachMePlus Data Analysis

Figure 3. Four days of data collected by a 12-player professional-level basketball team occupies 87 spreadsheet columns. Context is lost. At-a-glance observations about the changes in the physical condition of the athletes are difficult. A more robust user interface would help.


Software tends to work better when the task and the analysis are well-defined. Technology gets better as developers, designers, and engineers improve their understanding of how it should be used. Requirements that start off murky eventually become clear.

Design Patterns” are what often maps the requirements for a user task to its implementation in a software interface. Design patterns also provide a helpful way to understand how good software takes advantage of modular components that work together. One design pattern is a reusable solution to a specific problem, like the easy solution to gathering health data by assigning clickable zones to a simple representation of the body. Good software is built component by component, where each component does its job, much like what coaches ask for from players. Design patterns provide a common language and helpful shortcut to bridge what users need from software to the code that helps do those tasks.

Design Patterns

Figure 4. The data represented on a spreadsheet for a Functional Movement Screen. Or the same data rendered using a representative point-and-click interface, an example of an interface solution from a Design Pattern.


More than with any other task, an AMS shines when asked to provide an overview, helping busy users see the big picture on a dashboard: that athletes are thriving, who might be injured, what practice patterns seem to get the desired results.

Stephen Few, a noted information design consultant, has articulated what makes for good dashboard design, “Visual monitoring involves a series of sequential steps that the dashboard should be designed to support.”

  • The user should begin by getting an overview of what’s going on and quickly identifying what needs attention.
  • Next, the user should look more closely at each of those areas that need attention to be able to understand them well enough to determine if something should be done about them.
  • Lastly, if additional details are needed to complete the user’s understanding before deciding how to respond, the dashboard should serve as a seamless launch pad to that information.
CoachMePlus Athlete Performance Profile

Figure 5. CoachMePlus makes extensive use of data dashboards.


It’s here, at the dashboard, that the AMS and the team using it have to be in sync. Software for athlete performance is going to incorporate a wide range of data inputs: weight, body composition, hydration, questionnaires, velocity-based training, sleep, nutrition, blood markers, fitness tests, movement screens, heart rate, heart rate variability, athlete tracking, readiness monitoring, load, video analysis and game analytics. The dashboard needs to reflect the priorities of the team, or it isn’t putting users’ attention where it should go.

Applied sports science depends on an effective athlete management system that has to do two very different things at the same time. It has to value the simple presentation of good dashboard design. And it has to capture the complexity of all the different facets of athlete performance. The tension to maintain simplicity while also adding new complex features is another fundamental consideration of user-center design.

The tension between design simplicity and feature complexity is likely always to be an issue for athlete management systems. New sensors and data sources continue to be invented. Teams are adding sports science personnel who bring a range of backgrounds and place new demands on the software. If you agree that AMS is opinionated software, you will want to pay attention to how an AMS is set to evolve on these fronts in the future.

Athlete Management System

Figure 6. The complexity involved with measuring athlete performance can be staggering, and it is increasing.


In addition to the tension between simplicity and new features, supporting collaboration among users is another design dimension that will shape the future of the AMS. Collaboration plays a role in turning information into actionable insights that will improve athletes and teams, and in using the evidence at hand for organization decision-making about players.

Authorities on effective collaboration point to the “shared artifact” as the thing that everyone has in common and which provides a single frame of reference for the group discussion. An AMS can be the shared artifact for all of the different stakeholders in a sports organization that helps them work together.

Athlete Management System Group Reporting

Figure 7. The AMS interface needs to transition effectively from views that serve individual users to group views that enable collaborative insight and decision making.


This is the AMS progression for doing sports science:

  • Start by simply entering data.
  • Do basic analysis.
  • Develop a unified dashboard.
  • Incorporate a wider range of sports science data inputs.
  • Increase the complexity of the data interface.
  • Ultimately make the AMS a tool for collaboration.
  • A progression, yes. An easy progression, no.

Advocacy, Customers and the Future of Athlete Management Systems

The goal for CoachMePlus (and our product development roadmap) has us getting more flexible and more collaborative as the product evolves. Inside our organization we are building out the APIs, data modeling tools and dashboard functionality for our internal product teams, These are the technical tools that will improve our internal collaboration, setting us up to work better with our customers and partners.

Already, customers can call with an idea they want to try and our tools enable less than a 24-hour turnaround. Eventually, the APIs, modeling tools, and dashboards should become self-service interfaces for teams to take greater ownership of how they use their data and which will help teams to extract maximum value of athletes’ data.

There are many pathways to realizing potential; it’s true for athletes, and it’s true for technology. Each athlete management system is going to have unique elements for the team operating it. If the team has someone whose job is to administer the AMS, all of the ongoing change in sports science is going to make for challenges.

High up on the list of challenges is the way an AMS administrator has to represent all of the different stakeholders and be an advocate for athletes, coaches, clinicians, trainers and team management as he or she guides the evolution of the AMS and the workflows a team uses with the AMS. The point: It’s not enough to simply passively administer the team AMS, not when these products are set to evolve rapidly, even within the timeframe of a team’s season.

AMS administrators are advocates when it comes to working with CoachMePlus or any of the developers of the technology. Administrators are the voice of their team’s otherwise voiceless stakeholders who benefit from the technology. The better those team-side communication channels are working, the more aware AMS administrators are of their needs when they have their conversations with their technology partners.

Teams that make the most out of sports science will need to make the most of their athlete management system, and that will be difficult for teams that choose to be passive participants in AMS evolution.

Ultimately teams will get the AMS they deserve, based on how much they participate in moving the technology forward. In time, there will be communities of practice for applied sports science technology, but until that day arrives, the quality of the tools depends on the quality of the collaboration on teams, between teams and technology providers, and among everyone who comes together in the nascent community of sports science technology developers.

Participation is not mandatory and karma is not guaranteed. But please share so that you and your peers in the present and the future may benefit.


The post CoachMePlus: Athlete Management System for Decision Making appeared first on Freelap USA.

A Farewell to Arms? The Debate Over Arm Swing Mechanics in Sprinting

$
0
0


Outstretched Arms

By Ken Jakalski

No other issue regarding technique and mechanics for enhancing speed remains as controversial as the contribution of arm swing to faster sprinting. Even the world’s top coaches and researchers have different opinions on this issue.

Dr. Ralph Mann notes the following: “Contrary to popular belief, superior arm action does not produce superior sprint performance. In fact, regardless of the quality of the sprinter, there is no significant difference in the arm action. If a sprinter could improve the horizontal velocity simply by moving the arms faster, then even old, out of shape coaches could run as fast as the elite sprinter since virtually everyone can move their arms fast enough to produce an elite level stride rate of five steps per seconds.”

In his Mechanics of Sprinting and Hurdling (2010 Edition). The following line is underlined and in bold. “Thus, it is the legs, not the arms, that primarily dictate success in sprinting.”

He believes that whatever motion demands that are made upon the arms—like those in sprinting– can easily be produced.

However, Mann qualifies his position by noting that this doesn’t mean arms aren’t important in sprinting. “They are critical to the maintenance of balance,” he says, “as well as providing a slight vertical lift during each stride.

Frans Bosh, the author of the highly detailed and comprehensive book: Running: Biomechanics and Exercise Physiology Applied in Practice, has a different view.

“Clearly,” he says, “the action of the arms has a greater function during running than merely maintaining balance or compensating for the small disturbances in body posture.”

Bosch feels that one of the ways the arms contribute to the amount of speed that a runner can develop is by “increasing thrust in the direction of progression.”

However, he also says the following: “When running at speed, the upper body is held erect. As a result, the forward force provides by one arm to support push-off is just as great as the counteractive force moving the other arm in the opposite direction. The net result in the forward direction is equal to zero. There is no direct contribution to forward thrust during speed running.”

Legendary coach Charlie Francis remained a firm believer in the significance of arm mechanics to sprinting. “The arms can control the legs,” he noted, “when things are going right.”

But Francis offers his own caveat. “It should be noted that, while arms are extremely important in sprinting, and can help create the fluid, relaxed but powerful stride that every sprinter strives for, even the greatest arm mechanics will be of little use when leg mechanics are neglected.”

In an interview with Jimson Lee for Speed Endurance, Dr. Peter Weyand noted the following when asked about the importance of arm swinging in sprinting.

“Once a runner is up to speed, the arms swing largely like passive pendulums, providing balance, minimizing center of mass energy losses and conserving the body’s momentum. While arm movements are coordinated with torso and leg movements to achieve the energy transfers that minimize center of mass energy losses, they certainly do not control leg movements and have very little effect on the all-important ground reaction forces.

Dr. Ken Clark of West Chester University tends to agree with both Mann and Weyand.

“Once the runner is up to top speed, the arms mostly serve to counter-balance the legs and have minimal effect on setting the tone for stride rate or length. While I don’t have an issue with incorporating a few basic arm drive drills into the early portion of practice, I have not had success either as an athlete or coach by making arm action a big area of technical focus.”

Clark does look at upper body action (torso rotation, arm swing) as an indicator for issues with the legs. Since the arms are synched up with and counterbalance the legs, if there is excessive rotation or lack of a range of motion with one arm, it may indicate an issue with the motion of the opposite hip or leg that needs to be addressed.

And what is my contribution to this debate? Watch the following clip of World Paralympic sprint champion Tony Volpentest. Nineteen years ago, Volpentest ran on my high school track, clocking an amazing 22.94–without having feet or lower arms. As a result of that experience, coupled with what I learned during a visit to the Harvard Locomotion Lab in 2001, I drew the following conclusion about arm swing.


Video 1. Paralympic sprinter Tony Volpentest at the 200 meter finish.

“Arm swing is often unique to the body segment lengths, the location of muscle attachments and hard-wiring of each athlete, and arms, in general, perform like passive pendulums, providing balance and minimizing any center of mass energy losses. Arm swing does not control leg movement, and neither the amplitude nor direction of arm swing appears to contribute to force on the ground.”

So, is this one of those “load six issues,” something coaches should focus on if their “insides tells them too”?

A 2014 study, “Locomotor-Like Leg Movements Evoked by Rhythmic Arm Movements in Humans,” struck me as yet another unique take on the arm swing issue, at least on the basis of the findings of their rather unusual research project. As the authors note: “We found that moving the arms rhythmically on an overhead treadmill, as in hand-walking, often elicited automatic, alternating movements of the legs in a significant proportion of tested subjects as in normal walking, the frequency of leg movements increased with increasing frequency of arm movements during hand-walking.”

Their conclusion: “The bulk of the evidence, therefore, points to a predominantly active (neural) rather than passive (mechanical) nature of the leg movements evoked by hand-walking.”

This was, to say the least, an unusual experimental set-up. Subjects lay on their right side with each leg suspended in what they described as an exoskeleton. The subjects’ arms were free to move, even the lower arm, by way of a small pillow placed on a belt.

Overhead Treadmill

Figure 1.


So what were the participants asked to do?

They were instructed to “reach overhead to the treadmill and rhythmically displace their hands on the shifting belt of the treadmill as if they walked on the hands.”

And once the horizontal treadmill started up, what happened?

Leg movements were systematically elicited by those unusual “walking arm” movements. And these leg movements showed some similarities to those of voluntary air-stepping and upright locomotion.”

Does this then support the position–held my many– that fast moving arms make for fast moving legs?

Not necessarily. My first thought was that these findings reflect our evolution from four-legged locomotion. And the authors do mention that, human bipedalism is often thought to have evolved from a quadrupedal precursor. “One of the distinctive aspects of primate quadrupedal walking,” they note, “is the use of diagonal couplets of interlimb timing.”

Though the study does reinforce the idea that humans reveal a neural coupling between arm and leg movements, the researchers point out that the frequency of these leg movements tended to be lower than that of arm movements.
So what is going on?

What we may be seeing in an example of Central Pattern Generators, biological neural networks that produce rhythmic patterned outputs without sensory feedback. CPGs have been shown to produce rhythmic outputs resembling normal “rhythmic motor pattern production” even in isolation from the motor and sensory feedback from limbs and other muscle targets.”

Dr. Ken Clark suspects that the arms and legs are always linked from a timing and amplitude standpoint via these CPGs, but believes that notion of one exerting control over the other, as in the speed of the arms influencing the speed of the legs, is not possible.

Does this mean a farewell to the significance of arms in sprinting?

I don’t believe so.

Dr. Clark acknowledges that arm cues may be valuable when leg cues aren’t working for particular athletes. “Although it is the legs that transmit force to the ground and the ground reaction forces that ultimately affect the center of mass,” says Clark, “if leg or posture cues are not working, potentially arm cues could help an athlete’s leg technique.”

Many coaches contend that concentrating on the arm swing helps sprinters maintain good mechanics, especially during late stages of races where mechanics begin to break down. In that regard, why feel guilty about employing a training strategy that others might find unnecessary?

One of the great quotes from Hemingway’s A Farewell to Arms may be the best advice for coaches who value arm swing mechanics.

“You don’t have to pretend you love me.”

Please share so others may benefit.


References

  1. Bosch, Frans. Running: Running Biomechanics and Exercise Physiology Applied in Practice Fans Bosch and Ronald Klomp. N.p.: Elsevier, 2005. Print.
  2. Francis, Charlie. Key Concepts: Elite Series. N.p.: n.p., 2008. Web. 2008.
  3. Interview with Peter Weyand.” Interview by Peter Weyand. Jimson Lee, n.d. Web.
  4. Mann, Ralph. The Mechanics of Sprinting and Hurdling. Place of Publication Not Identified: CreateSpace, 2011. Print.
  5. Mann R, Sprague P. (1980) A kinetic analysis of the ground leg during sprint running. Res Q Exerc Sport. 51(2):334-48.
  6. Sylos-Labini, Francesca, Yuri P. Ivanenko, Michael J. Maclellan, Germana Cappellini, Richard E. Poppele, and Francesco Lacquaniti. “Locomotor-Like Leg Movements Evoked by Rhythmic Arm Movements in Humans.” PLoS ONE 9.3 (2014): n. pag. Print.

The post A Farewell to Arms? The Debate Over Arm Swing Mechanics in Sprinting appeared first on Freelap USA.

How to Use Barbell Trajectory Analysis to Improve Performance

$
0
0


Athlete Prepares to Lift Barbell

By Carl Valle

The current practice of using barbell speed measurements in the weight room is at a critical mass. Several pioneers in applied sport science and the coaching profession have moved the needle significantly, for both elite athletes and gym rats, with practical research and cutting-edge methodology. While Velocity Based Training (VBT) is a major factor in training the primary lifts, it’s the tip of the iceberg with what can be done by using comprehensive barbell analysis.

Bar speed—peak or average—is vital in improving training outcomes. Adding more of the right information can break through barriers and increase the precision of any program. In this article, we will explore the hidden factors in key exercises for lower body power and share ways to look at the data more intelligently. Besides analysis, we also suggest adjustments with small tweaks. Athletes at any level can reap more rewards by diving into bar trajectory metrics.

Barbell Trajectory Sport Science

What is the definition of barbell trajectory, and what does it offer someone beyond the two popular bar speed metrics of peak and average? One can make a case that 2015 was the year of VBT. If this article does its job, 2016 could be the year of BTA (Bar Trajectory Analysis). The big picture of barbell analysis is essential to maximizing training time and effort. Those who want to stay comfortable by looking at intermediate feedback of gross bar speed are missing the following:

  • Bar displacement – The sum of the entire distance the bar travels from start to finish of the lift.
  • Bar activity duration – The sum of the entire time of the exercise performed. This score can include the accessory motion of the liftoff and other small contributions to the exercise that many forget. For purposes of education, the exercise performance will be used in this working definition.
  • Bar directional measures – The contributing bar motion in space from the start to the end of the exercise.
  • Bar relative measures – The relationship between the bar motion path in the exercise and the body anthropometry of the performer.

Take note—these four metrics are not all that can be done with barbell analysis, but trying to swallow too much often overloads coaches and is overkill for those doing an honest job with athletes. A simple way of looking at less common measures is thinking in terms of the context of the bar speed at which one is usually training. Bar speed is simply a snapshot of a moment in time, not the complete picture of what is going on. Bryan Mann’s work gave coaches a working understanding of how different exercises can be evaluated. It was never intended as a road map, but more a compass for speed to orient everyone. Bar trajectory may be viewed as the route and scale on a nautical map. The coach is the captain of the ship in this analogy, and may change course along the way based on wind and weather.

These four metrics are foundational. Using them as a framework can help anyone perform popular lifts better. Nothing in technology will replace coaching, but not using technology that provides objective data is egotistical and retards the progress of sports training. Here are some real-world examples to help illustrate these metrics in applied training settings.

How Bar Displacement Influences Bar Velocity

Bar Trajectory and Velocity

The total straight distance the barbell travels—mainly vertically overcoming gravity—is a major reason bar velocity can be deceptive if not interpreted correctly. How much distance athletes have to work with determines what they can generate with regards to bar speed. “Impulse” is perhaps a better word for coaches, but the clarity of how far the bar travels and in what way is important to convey. One example that anyone who performs the snatch in various forms can relate to is modifying starting position and grip. These changes can create a significant change in bar velocity without actually indicating an improvement or loss of power ability.

Photogrammetry in the early 1970s used film and smart math to extract information. Similar to Muybridge proving that horses had all four legs off the ground simultaneously, photos at high shutter rates explained how champions executed their winning performances. The perception of the barbell path as a straight line to the naked eye was indeed inaccurate. The bar moved slightly away from the lifter.

Another revolutionary leap with sport science began in the mid-1980s as computers became real tools for greater insight. Swedish sport scientists mapped out bar trajectory metrics at the 1985 World Championships in Weightlifting. They analyzed both horizontal (minimal) and vertical motion with amazing precision. They traced the bar path, and the actual distance of the bar was longer than the maximal vertical displacement. What can get tricky is the understanding that distance traveled and displacement are not synonymous. A 400m runner travels about a quarter mile and winds up virtually back at the starting point.

In weight training, the key is breaking down the total distance traveled and the starting and finishing positions for smarter evaluation. Most motions are not perfectly straight lines from point A to point B, so focus on what is accepted as technically proficient in the literature. Most athletes find success by improving the output of the lifts through coaching and better programming.

Why Bar Duration Matters for Nervous System Fatigue

The fatigue rate of muscle contractions is not crystal clear in the scientific literature, but a general summary of short explosive bursts as the best approach to developing power is a fair conclusion. General duration—regardless of how far the bar moves—is a safe bet in getting more output with less risk of unnecessary fatigue. The bar distance, direction, and duration or time traveled give context to bar speed. For example, the deadlift is very effective but comes with a price to pay later. The key reason is that heavy deadlifts performed without wide stances take a long time to complete.

A clear relationship exists between mean and peak power/velocity and lift duration. A slow motion simply takes more time to perform, and high-velocity movements (all else being equal) take less time. Powerlifting and Olympic weightlifting are about the greatest possible loads. Usually, the time of the rep of Olympic movements stays close to the lighter loads, while power lifts vary speeds more. Fatigue is a normal and essential part of training, but only when one can adapt to it. Otherwise, it’s unnecessary “overflow” or residual exhaustion. The return of cluster sets for greater outputs is coming back in a full circle as they increase output, and it’s up to coaches to see how they can weave them into seasonal training plans.

We currently don’t know the intimate details of why central and peripheral fatigue alter strength, speed, and power training. We do know that the explosive motor units in Type II fibers can be burned out from work that involves high effort and long duration. In the future, it will be up to sport scientists to collaborate with real training programs to discover what happens and how coaches can improve results and minimize errors.

Bar Directional Measures and Neuromuscular Adaptations

Concentric and eccentric actions are not new, and we are starting to see how simple muscle contractions are not just lengthening and shortening. The key point with barbell tracking is that velocity is constantly changing, and the direction the bar travels is dangerously underappreciated. The gradual collapse of the athlete health in sport is frightening because of the fears of overtraining. Muscle soreness, a subjective monitoring point in muscle damage estimation, is overly relied on and inflated from an aversion to strength training.

A vicious cycle of injury and lack of training continues as most programs classify exercises based solely on anatomy versus important factors like neural response and, in this case, eccentric contractile dynamics. A hexagonal deadlift does induce muscle recruitment to the posterior chain, but most athletes drop the weight rapidly with gravity versus resisting it. Eccentric qualities must constantly be under surveillance. Otherwise, it’s easy to get into a program that doesn’t improve the ability to yield.

One excellent example of bar direction making a difference is the receiving point and distance of competitive lifts versus sport preparation options. The power clean and power snatch with a squatting pattern finish are different than catching the bar lower with a shallow descent.

Bar Relative Measures and Body Types

Athlete anthropometry is a major variable in performing the lifts and interpreting their performance. While barbell and plates are standardized, athletes’ bodies come in many different shapes and sizes. Style of execution must also be considered. A narrow-grip bench press by a developing college power forward is much different than a traditional grip by a short veteran NFL running back.

Coaches and athletes can look at bar velocity more intelligently by considering bar load, body weight and composition, and effort. Load and bar speed are related to the weight of the athlete, readiness to train, motivation, and effort. Larger athletes are usually taller as well, so higher speeds may not be due to power, just the amount of available time.

Rate of force production (RFD) is an emerging metric with bar velocity tracking, but the concept is far from new. The primary issue with RFD is that measurement is hard to define specifically with exercises and is very sensitive. RFD is inappropriately perceived as explosive starting power, as most exercises from the floor or a static start are prone to protocol inconsistency and mechanics of the lift. Examples are jump squats with variable starting leg joint positions or not adhering to rest periods. Other examples are the style of cleans or snatches that may have slower starting speeds to favor the second pull or athletes with less mechanically advantageous positions due to anthropometric factors. Finally, RFD is based on a time interval in milliseconds, so it’s wise to observe peak velocity to ensure that the numbers are valid. This doesn’t mean RFD is a poor metric. It just points out the need for interpretation and being privy to the context of the data collected.

Getting Started Now With Bar Trajectory

This article explains major contributing factors in improving performance in the granddaddy exercises and adds more value to preexisting measures of peak and mean velocity. The next logical question is what can be done with bar velocity and power indices of the GymAware system and assisting those scores with in-depth analysis.

After collecting the data, the numbers will spark change and shed light on what is holding one back. Every athlete and every movement are unique enough to require an individualized process that teases out what is sensible and what likely needs to be improved. Most people in the iron game can decode the data by simply seeing it, not by sending the numbers to a data scientist or uploading the file to powerful software. What has worked for many coaches and athletes is identifying the problem by profiling the pattern of the movement they want to improve and then engineering ways to augment the performance with hard work and patience.

Please share so others may benefit.


GymAware Leaderboard

Suggested Reading

Izquierdo M, González-Badillo JJ, Häkkinen K, Ibáñez J, Kraemer WJ, Altadill A, Eslava J, Gorostiaga EM. “Effect of loading on unintentional lifting velocity declines during single sets of repetitions to failure during upper and lower extremity muscle actions.” Int J Sports Med 27: 718–724, 2006.

González-Badillo JJ, Sánchez-Medina L. “Movement velocity as a measure of loading intensity in resistance training.” Int J Sports Med 31: 347–352, 2010.

Harbili E, Alptekin A. “Comparative kinematic analysis of the snatch lifts in elite male adolescent weightlifters.” J Sports Sci Med 13: 417–422, 2014.

Pareja-Blanco F, Rodríguez-Rosell D, Sánchez-Medina L, Gorostiaga EM, González-Badillo JJ. “Effect of movement velocity during resistance training on neuromuscular performance.” Int J Sports Med 35: 916–924, 2014.

Oliver JM, Kreutzer A, Jenke SC, Phillips MD, Mitchell JB, Jones MT. “Velocity drives greater power observed during back squat using cluster sets.” J Strength Cond Res, 2015. Epub Ahead of Print.

Cronin JB, McNair PJ, Marshall RN. Force-velocity analysis of strength-training techniques and load: Implications for training strategy and research. J Strength Cond Res 17: 148–155, 2003.

Baumann W, Gross V, Quade K, Galbierz P, and Schvvirtz A. The Snatch Technique
of World Class Weightlifiers
at the 1985 World Championships Int J Sport Bio 4;68-89, 1988

The post How to Use Barbell Trajectory Analysis to Improve Performance appeared first on Freelap USA.

Viewing all 211 articles
Browse latest View live